
By Ellie-Rose Davies, Content Executive, IMRG
It’s now time to reflect on the biggest event in the retail calendar – Black Friday!
This blog takes you through key data points and analysis of this event, enabling you to benchmark your performance and gain key insights for growth next year.
So, what happened during Black Friday week?
IMRG carried out their annual Black Friday tracker, which is representative of 130+ retailers and £1.1+ billion in sales across the 8-day week (Mon 20th – Mon 27th Nov). Part of the analysis included the Year-on-Year (YoY) online revenue performance for each day of the big week.
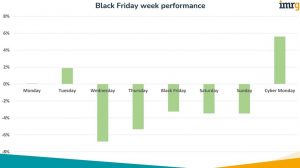
Monday started off with flat growth (0% YoY), which was promising considering the consistent declines we have reported throughout the year. Tuesday generated a great deal of excitement, as the industry average was up +1.9% YoY. But then came Wednesday, Thursday, Black Friday, Saturday, and Sunday, which all saw declines, with Wednesday, full of woe, reporting -6.8% YoY.
Could Cyber Monday save the week? Thankfully it did not fail, at +5.6% YoY. During our post-Black Friday events, retailers and industry experts unanimously agreed that the late November pay day contributed to the success of Cyber Monday, seen as lots of the UK population would have been paid on that day. It also seems that customers are more inclined to wait for the best deals, hence why they’d rather wait until the Monday to make their purchases.
The overall result for Black Friday week was -1.9%, just 0.1 percentage points off from IMRG’s prediction!
Francois Rychlewski, VP of Sales, EMEA at SheerID describes how ‘UK shoppers prepared for Black Friday week, waiting to extract the most value from huge sales increases. UK stores took three times as much revenue over the period than the weekly average for the rest of the year.’
The reason for this, according to Francois, is that ‘consumers respond positively when they feel rewarded and emotionally connected to the brand. Steep discounts like the ones many brands offered this Black Friday can bring about loyalty and repeat purchases all year long.’
Did campaign lengths differ this year?
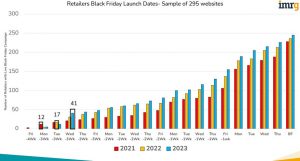
This year, Black Friday campaign lengths followed the trend lines as, yet again, the campaigns were pushed even earlier in the calendar.
To help you make sense of this, I’d like you to look at the bar chart and focus your eyes on the bars with black boxes around them. Each of these bars represents the 1st November (red – 2021, yellow – 2022, and blue – 2023). This year, 41 retailers started their campaigns on this date, compared to 17 in 2022 and 12 in 2021, suggesting that retailers are aware that they can maximise profits over the whole month.
Alfie Staples, Senior Global Insights Manager at Awin reiterates how ‘brands embraced heavy discounting periods.’ He says, ‘36% of total retail sales converted with a voucher code and offers went live as early as late October.’
Noticing increased competition throughout the entire month of November, Patrik Lackström, Analyst at Voyado says, ‘We monitored the development of customer communication daily during Black Week. This year’s campaigns have been notable due to significantly earlier start times and increased volumes for both email and SMS.’
He continues, ‘Compared to the previous year, the total volume of email messages sent to consumers has increased by 26%, while the number of SMS messages sent has increased by a remarkable 40%.’
How did individual product categories perform?*
*You can see how 32 categories/subcategories performed across a variety of metrics throughout Black Friday week on IMRG’s Digital Dashboard.
The clothing category was the worst performing category in IMRG’s Black Friday tracker, performing significantly worse than we forecasted, at -9.6% YoY across the week. Gifts (-5.7%) and home & garden (-2.4% YoY) also saw declines. Health & beauty had a great time, achieving +7.6% YoY, and electricals achieved +2.7% YoY.
Gavin Murphy, CMO at Scurri, provided some insights on other categories, such as ‘Pet & Animal (+44%), which experienced YoY growth over the Black Friday period.’ Other, perhaps “nice to have”, categories reported declines, such as Toys & Games (-0.5%).
While some categories performed better than others, Alfie Staples from Awin reports on some positive news, exclaiming that ‘Predictions suggested a dampened Black Friday due to the continuing cost-of-living crisis. Yet, performance via the affiliate channel outperformed expectations.’
According to Awin data, ‘Both sales and revenue across Europe were up annually, +3.3% and +6.0% respectively, driven by increased AOVs as consumers spent €2.33 more on average across key sectors like Electronics, Fashion, and Home & Garden. The greater adoption of upselling and cross-selling technologies by advertisers also contributed to higher spending.’
Looking at category differences, Burc Tanir, CEO & Co-Founder at Prisync states that, ‘From our observations at Prisync, mainly through our price index analysis in categories like electronics, pet supplies, cosmetics, and toys, we’ve seen mixed strategies among retailers.’
‘For example, in the UK cosmetics sector, we noticed diverse shifts in pricing,’ says Burc: ‘Amazon’s index rose by approximately 9.18%, eBay’s by 11.60%, and Onbuy decreased by 5.26%. Understanding the trends is crucial for any retailer aiming to stay competitive. For Black Friday 2024, it’s vital to remain dynamic and constantly learn from the market.’
What were the cross-border trends?
With financial strain on UK customers, many retailers put their focus on optimising cross-border sales.
Gavin Murphy from Scurri reflects on this, sharing that ‘As UK consumers struggle in the face of tightened fiscal and economic policy, it is no surprise that total order volumes in the UK declined -5% YoY. Conversely, volumes into France (+17%), U.S. (+33%), Germany (+16%), Poland (+187%), Denmark (+21%) and Belgium (+34%) were buoyant, reflective of an increased demand and focus on international markets despite the ongoing challenges of Brexit.’
Across the Scurri platform, Gavin reports that ‘The following delivery services experienced YoY growth – Next Day Domestic (+107%), Express with Signature (+27%), and Express International (+15%) as consumers still opt for speed of delivery despite the cost and environmental impact. We can also deduce international consumers are opting for express delivery for convenience despite the extra costs.’
Deann Evans, Managing Director, EMEA at Shopify said that with ‘over 61 million consumers who purchased from Shopify-powered brands, sales peaked at $4.2 million per minute on Black Friday. Top-selling countries included the US, UK, Australia, Canada, and Germany, while Los Angeles, NYC, and London were the leading cities.’
The trends also show that ‘Cross-border orders constituted 15% of global activity, and the platform saw a 60% YoY increase in Shop Pay sales.’
A partner of Shopify, Brightcove, provided further insights, with Theo Hildyard, VP, Demand Generation, revealing that ‘Shopify recorded $9.3 billion in sales over the extended weekend, a 24% increase on last year. With bricks and mortar sales only increasing by 1% on the previous year, it is once again clear that the most successful campaigns were those that offered engaging online experiences.’
Theo says, ‘Consumers feel more in the driving seat when purchasing online and businesses that offer personalised, interactive video experiences will have the upper hand in earning brand trust as we head into 2024.’
Were there any delivery or returns trends?
This year retailers were met with an early Christmas gift of no delivery strikes during Black Friday, unlike last year which caused much distress and lots of unfulfilled orders, affecting customer sentiment.
This is good news seen as Sean Sherwin-Smith, Product Director, Post-Purchase at nShift says, ‘This year’s Black Friday has been defined by delivery.’ nShift conducted research with ‘almost 10,000 online shoppers and found that 70% of Black Friday shoppers were looking for free deliveries, alongside low product prices, before buying.’
nShift also found that ‘50% of respondents would opt for faster delivery and a further 28% would buy if offered appropriate delivery options reflecting their needs. These findings highlight just how important it is for retailers to get the post-purchase experience right to differentiate from their competitors and give consumers the experience they want.’
‘In practice,’ says Sean, ‘that means having access to a wide variety of carriers, including high-speed and low-emissions options.’
Regarding orders, Signifyd’s Director, Financial Services and EMEA Marketing, Amal Ahmed commented, ‘Shifting consumer behaviours mean merchants need to be prepared for higher order volumes throughout the festive season by deploying order automation to speed transaction reviews, reduce false order declines and ensure rapid fulfillment.’
More orders also welcome more returns. Monica Eaton, Founder at Chargebacks 911 shares that ‘the shopping frenzy is often followed by a spike in returns that can follow immediately or after the holidays in January. It has previously been estimated that around one in three shoppers will return what they buy, and in 2022, the biggest day for returns was the Monday immediately following Black Friday.’
She continues, ‘Many of these returns are fuelled by buyer’s remorse. This can lead to returns, disputes, and even chargebacks. Given current economic challenges, the number of people regretting their purchases may be even higher this year.’
Monica urges retailers to ‘Take steps to mitigate instances of buyer’s remorse by facilitating a space for customers to share experiences, showcase the benefits of their products, as well as offer multiple payment options and alternative payment methods that alleviate the financial burdens of customers, making them less apt to return a product for a refund.’
With high return rates being likely, it is unsurprising that Nick Williams, Director of Parcel Services at PayPoint plc says, ‘New data from Trustpilot has shown that 63% of consumers make purchasing decisions based on the company’s returns policy, while 47% value convenient returns locations.
‘As a result, as retailers look ahead to 2024 and as consumers continue to consider each step of the purchasing process before making spending decisions, retailers should continue to make each step as seamless as possible.’
If you’d like more information on Black Friday performance, register for our first webinar of the new year here: IMRG Virtual Black Friday 2023 Results Reveal – IMRG.
IMRG members can catch-up on or rewatch our latest Weekly Data Shows concerning Black Friday in our webinar library here: Webinar Library Archives – IMRG.
Not a member? Enquire to join our community here: Join us!
The most detailed insight is available on IMRG’s Digital Dashboard, which provides weekly benchmarking capabilities across a vast number of metrics.
Published 15/12/2023
