

By Bradleigh Ward, Search & Content Manager at SaleCycle
Using data from the SaleCycle 2021 Ecommerce Stats & Trends Report we analyse buying patterns and compare global ecommerce stats and trends from 2019 to 2020.
The new research has revealed Thursday is the most popular day of the week for online shopping with Wednesday a close second.
As remote working has increased since the pandemic began, traditional daily routines and working patterns of consumers have changed. Notably, there were two main peak hours in 2020 for online sales and they were between 10am-11am and 8pm-9pm, however, in 2019 there was only a single peak at 8pm-9pm.
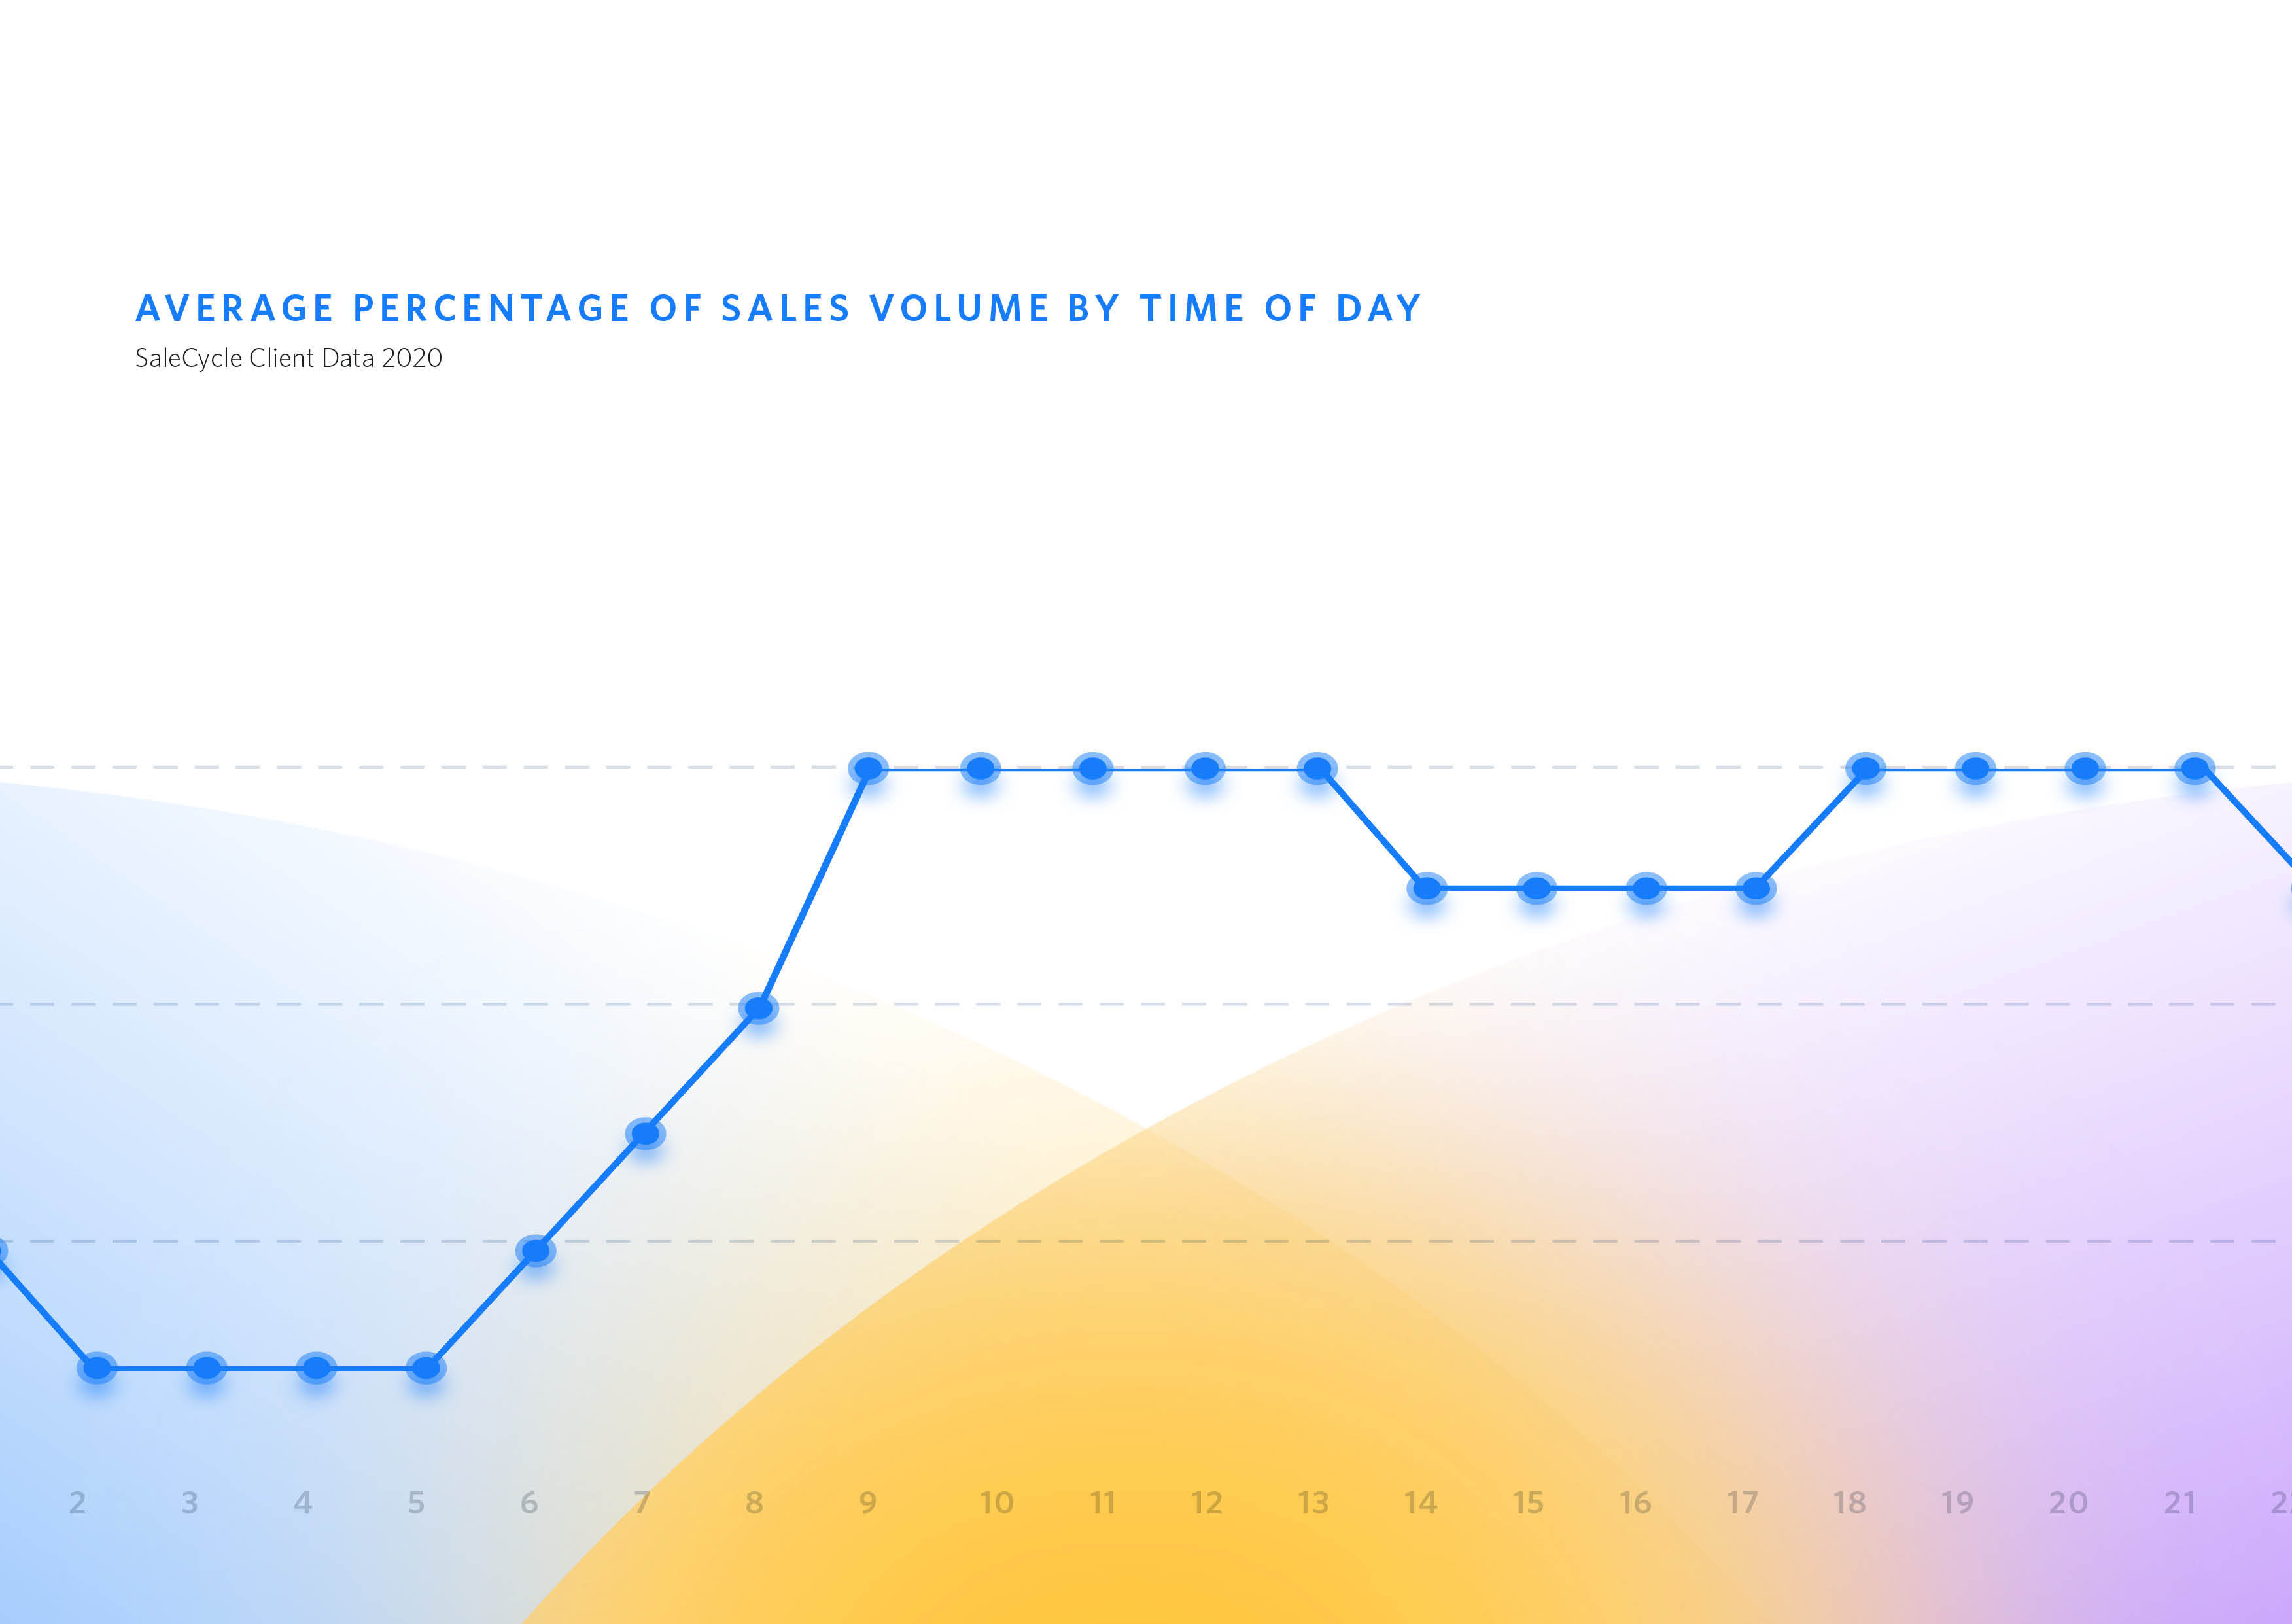
This draws a spotlight on how working from home has affected shopping habits. However, these new habits didn’t create a spike in new weekend online shoppers because the 2020 data revealed Saturday saw the biggest dip in online sales.
November The Highest Online Sales Volume & Growing
The SaleCycle Stats & Trends report also found that there were two major spikes across the year, one in May and then a huge pump in online sales in November.
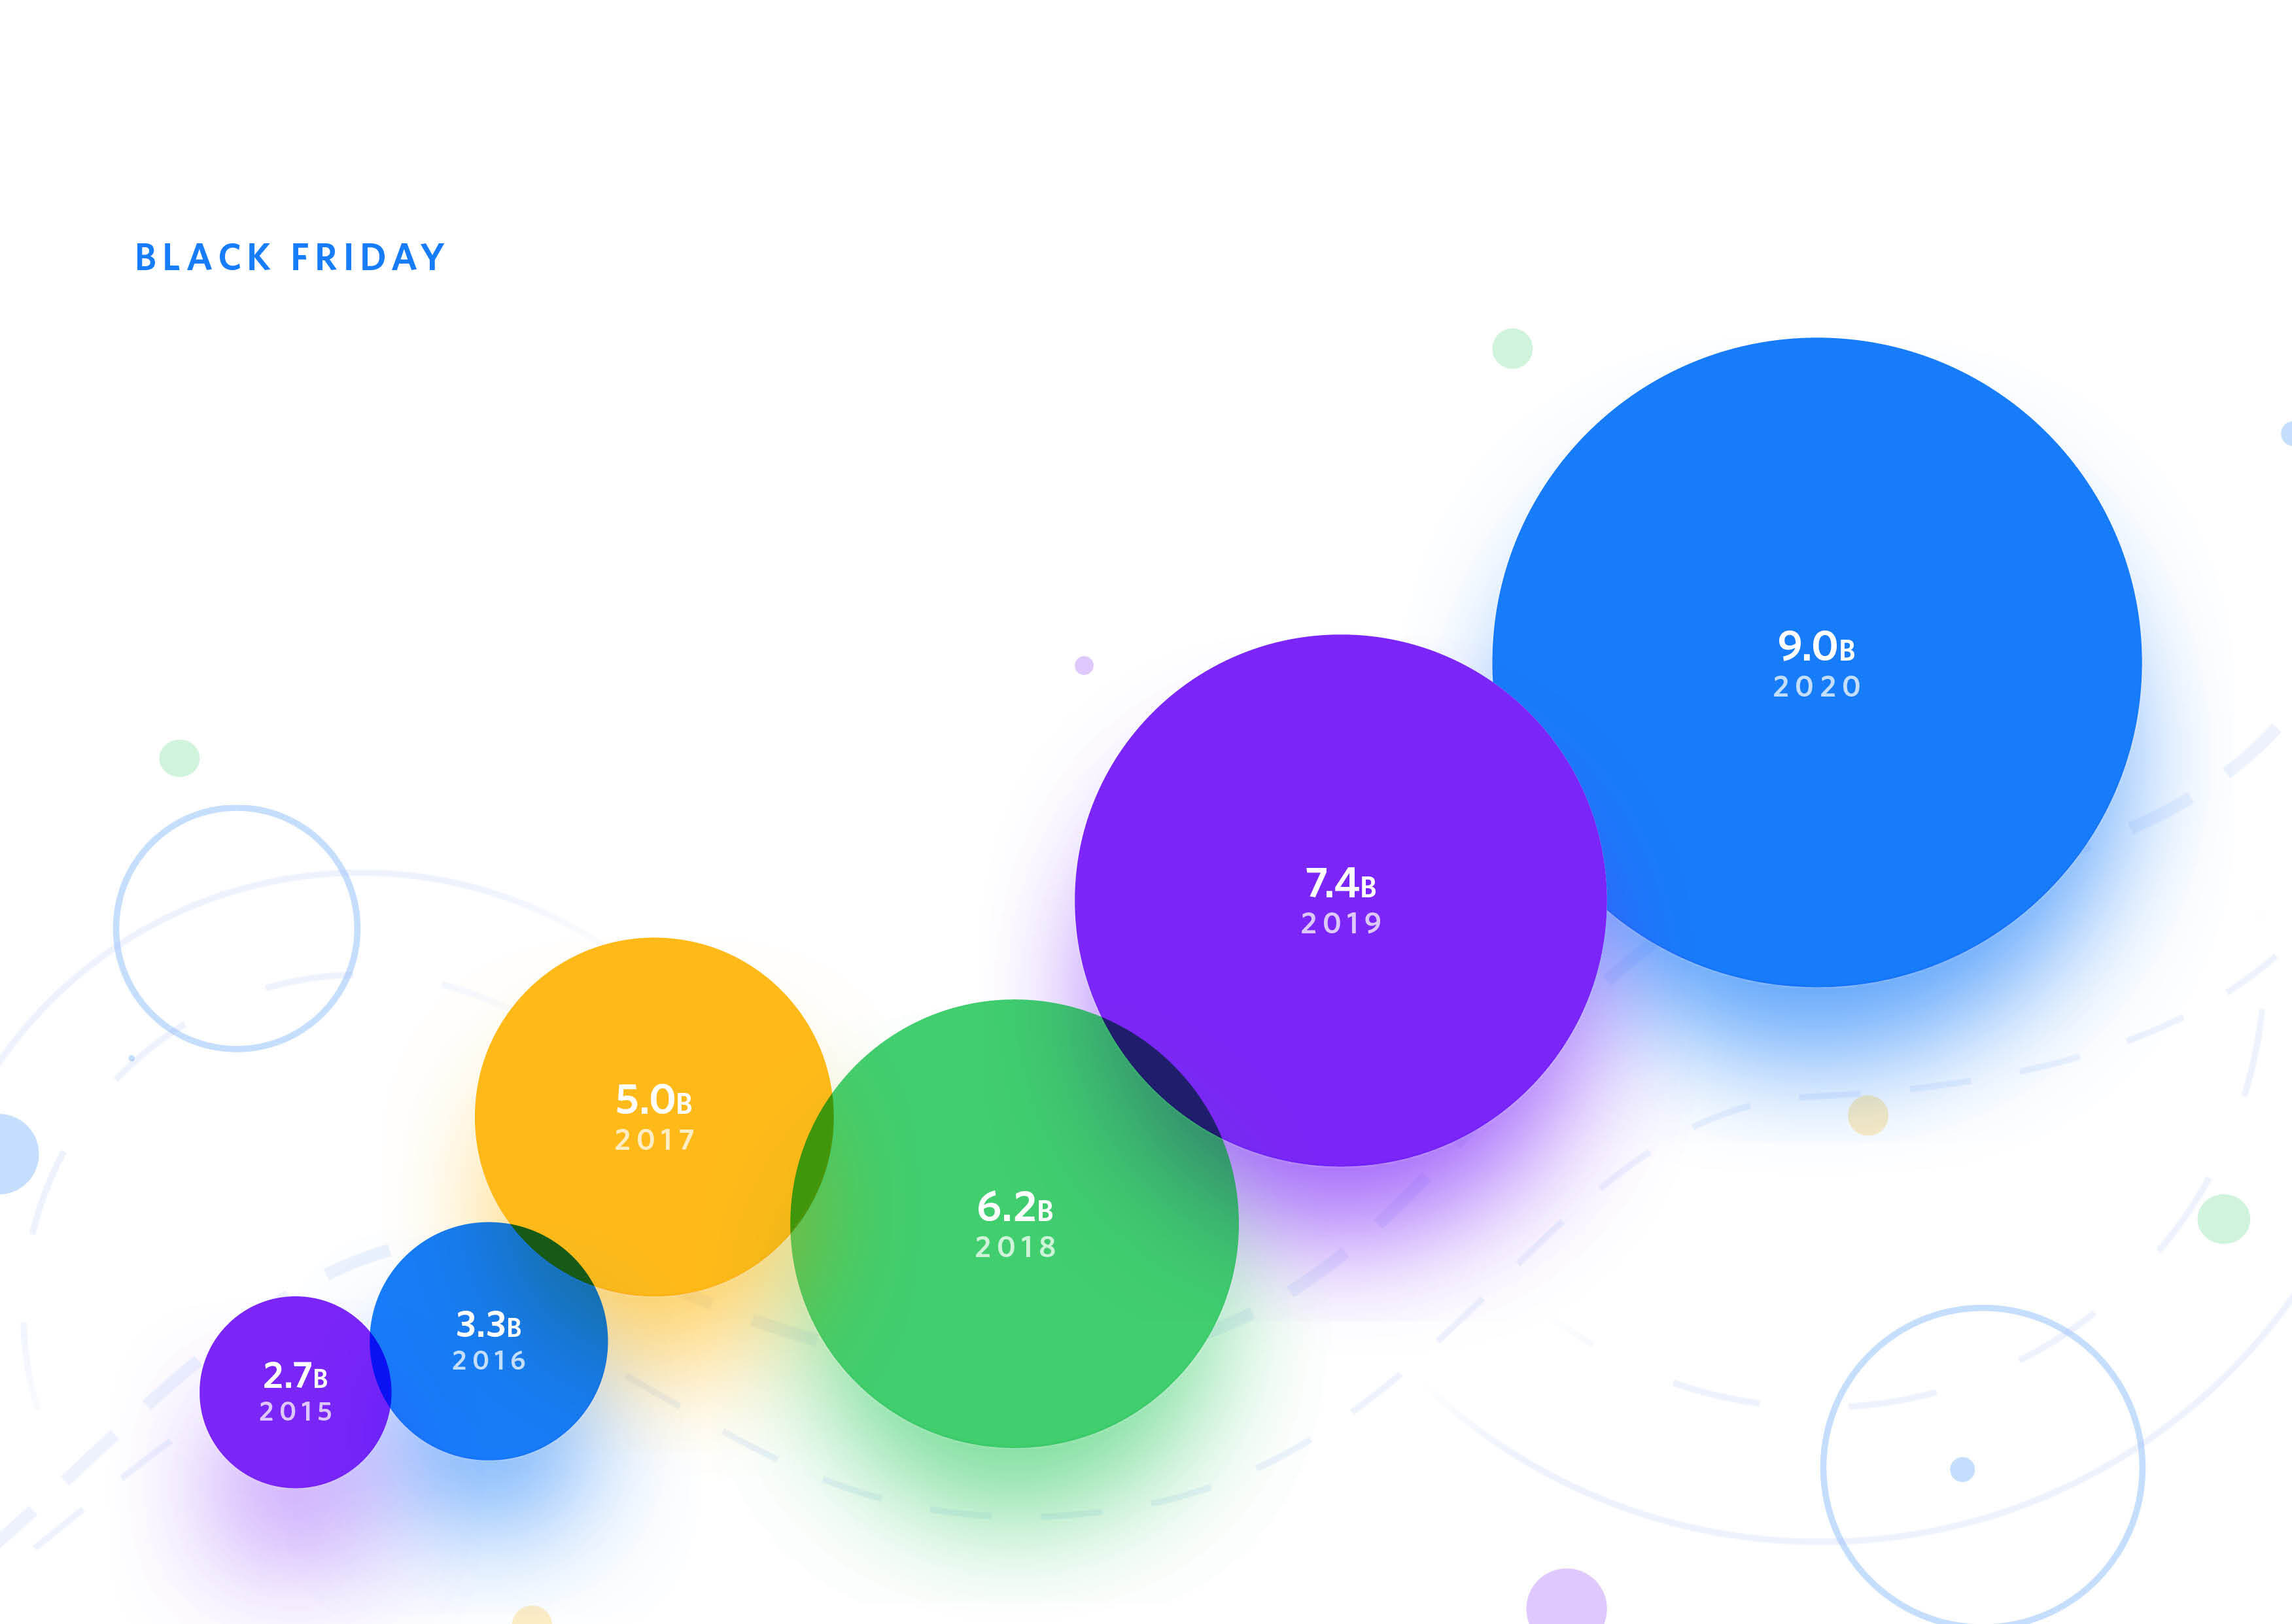
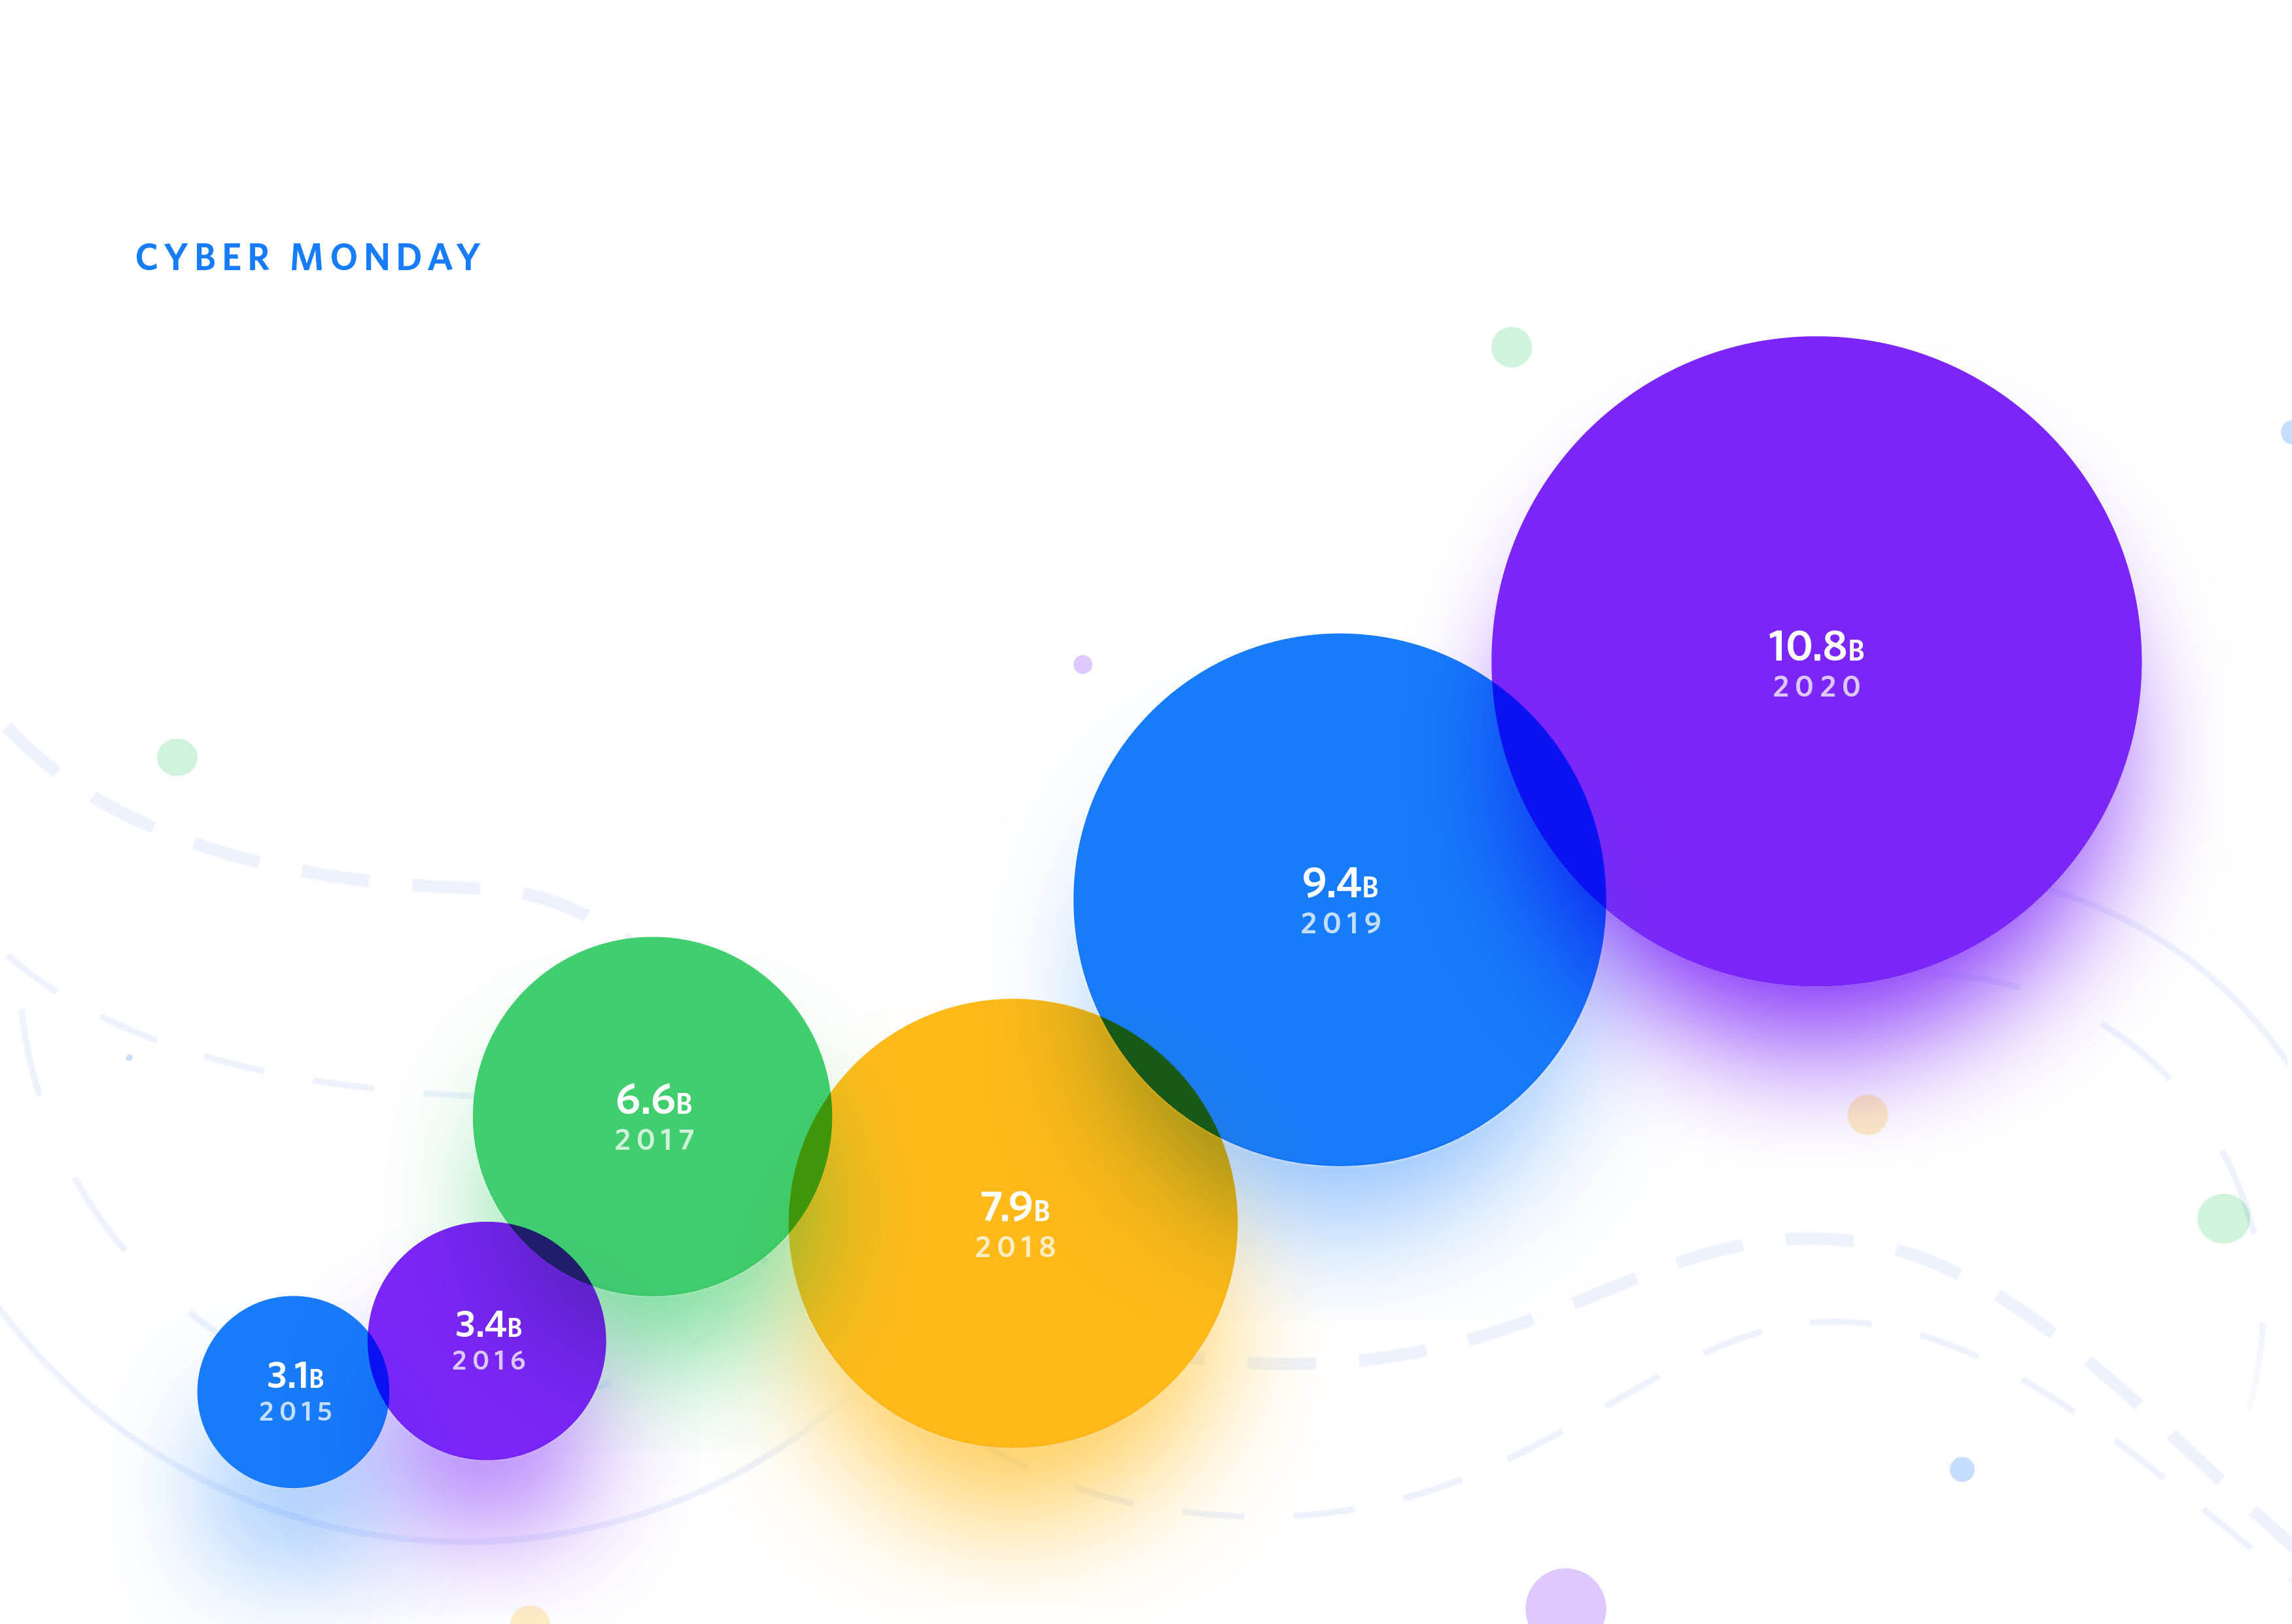
November is a premium month for online retailers with events like Black Friday, Cyber Monday, Singles Day and Thanksgiving all close together and around payday. These events are used by retailers to launch sales campaigns and there is a real sense of urgency, as time is of the essence. Christmas is also around the corner adding an extra incentive to shop, so this is a real opportunity to convert online shoppers.
As discussed, Black Friday is one of the busiest days of the year, along with Cyber Monday and the online sale volume has grown year on year since 2013. Black Friday has grown 21% since 2019 with Cyber Monday growing 17%.
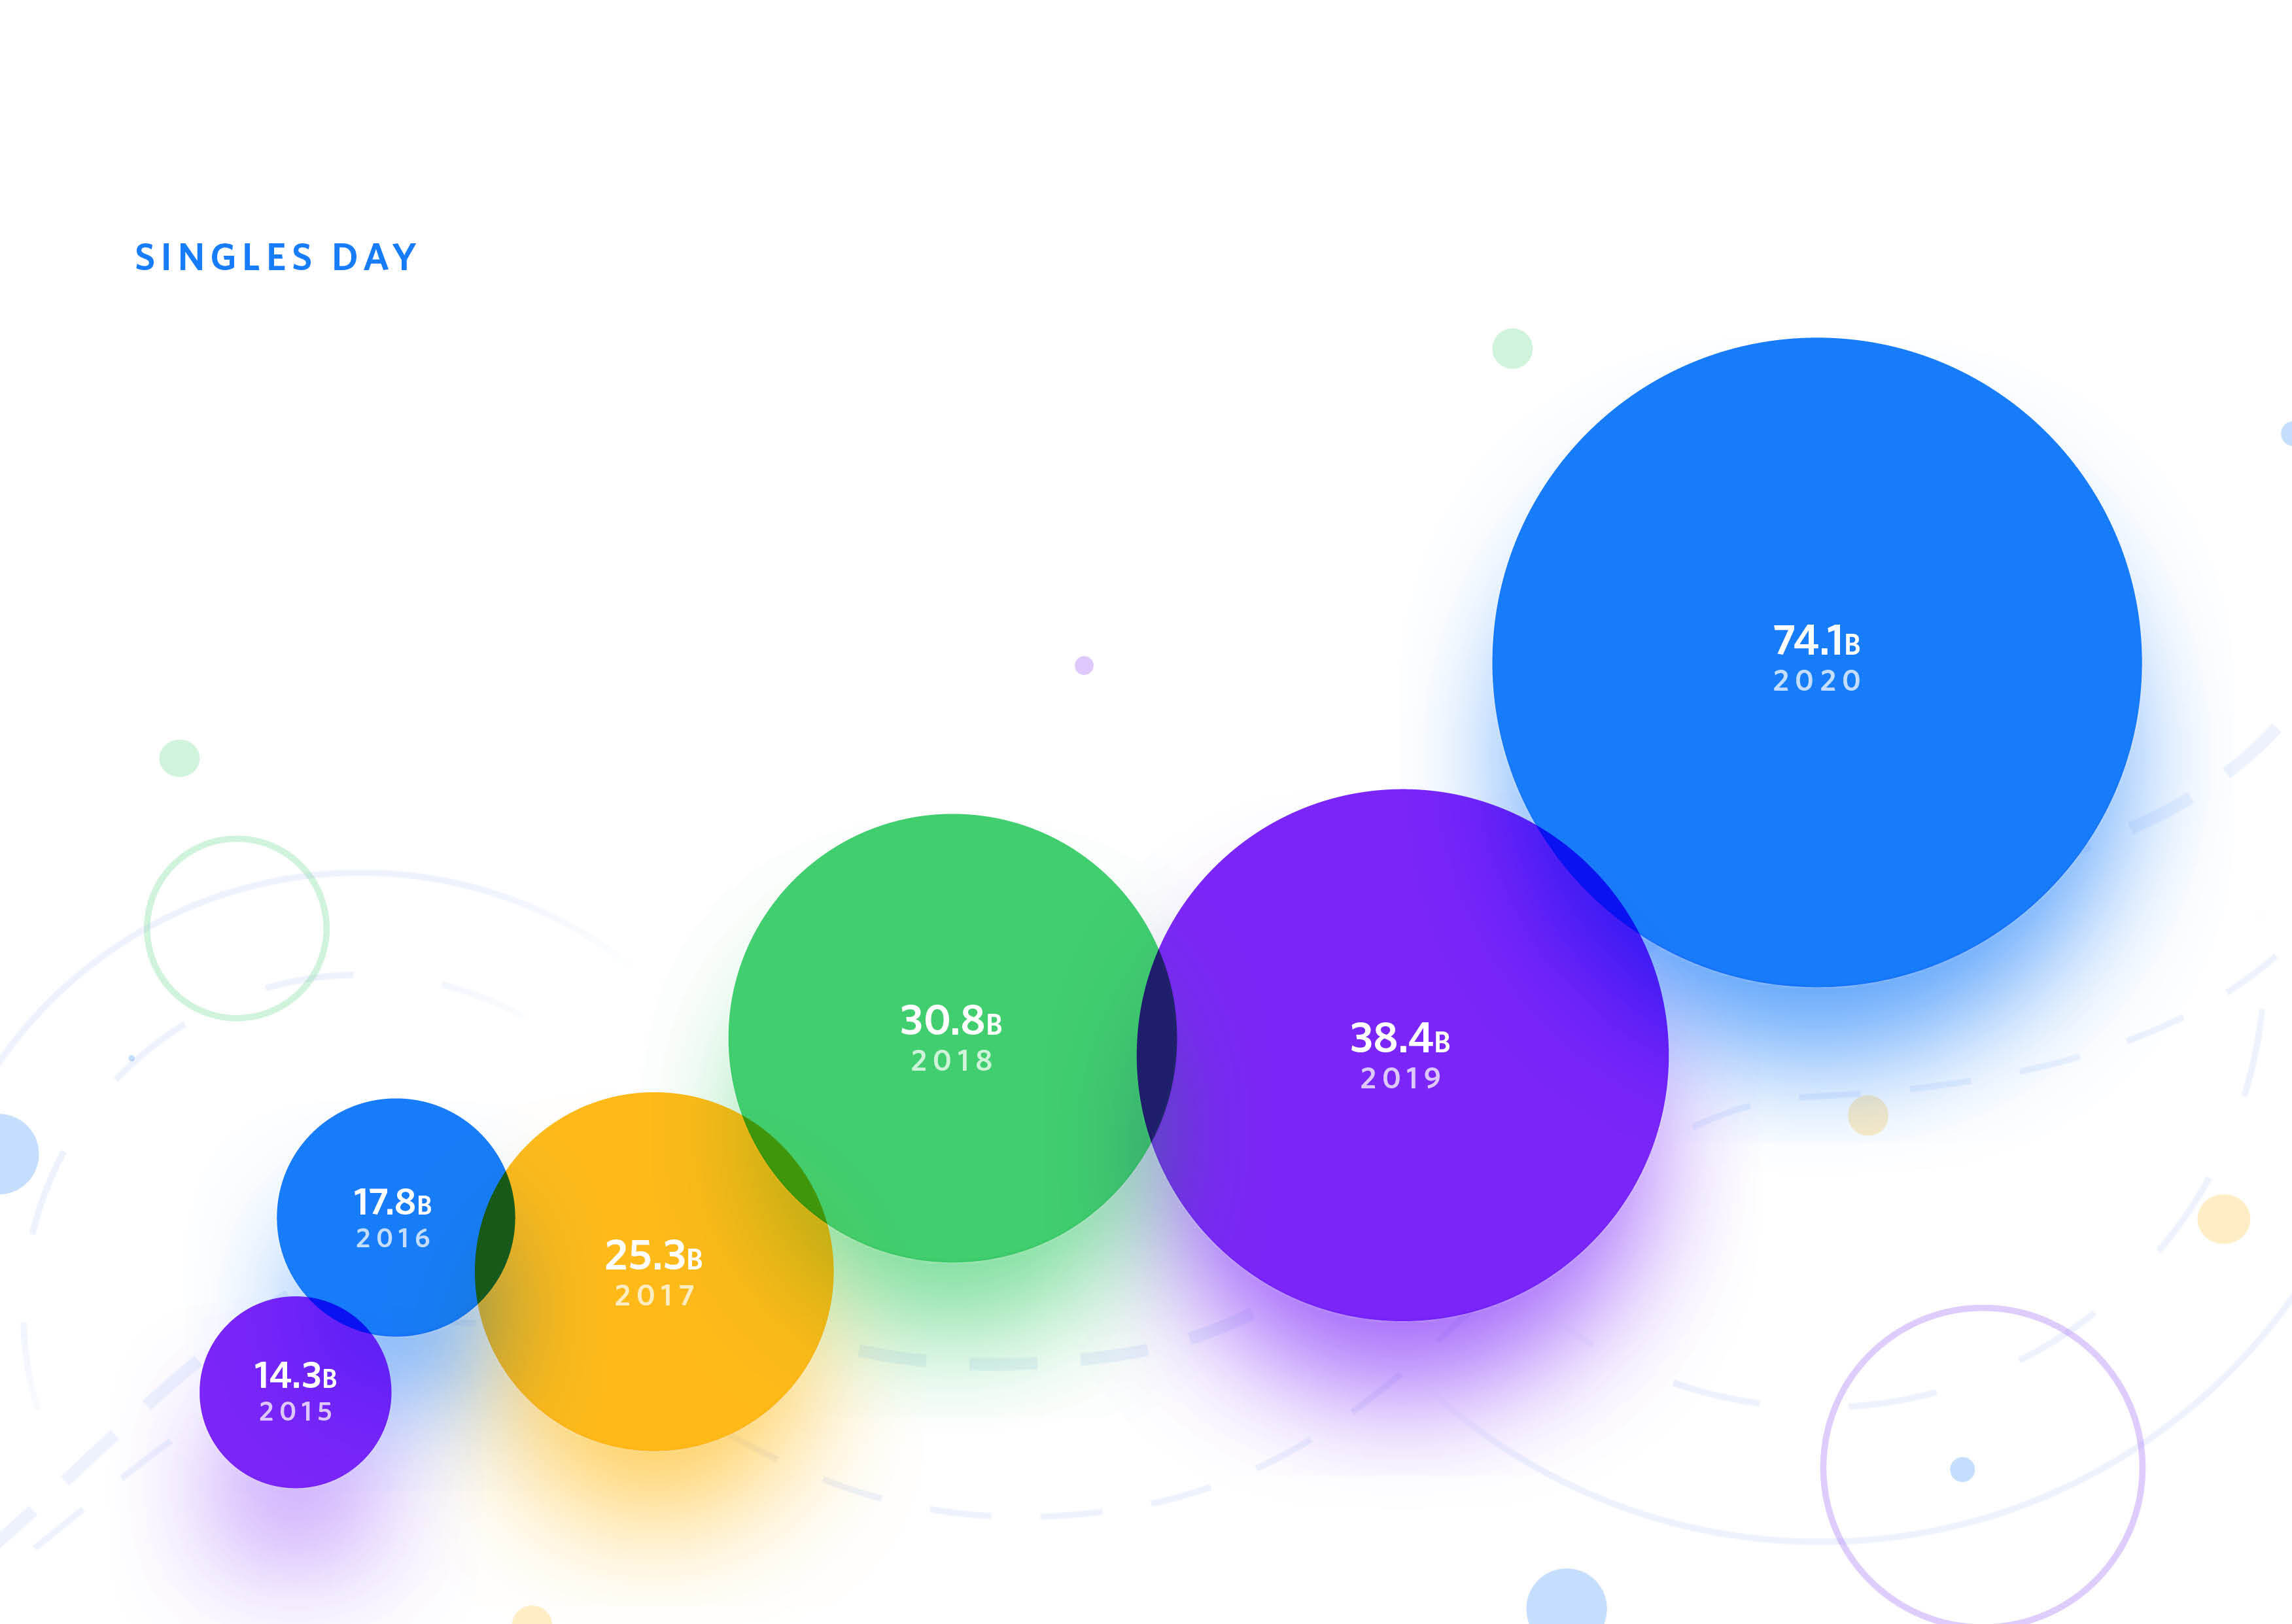
Singles Day is an Asian shopping event that was created as an anti-Valentines day holiday. However, the event grew 93% from 2019 to 2020. Singles Day is more than triple the combined value of Black Friday and Cyber Monday combined.
Online Shopping Habits Sector Drilldown
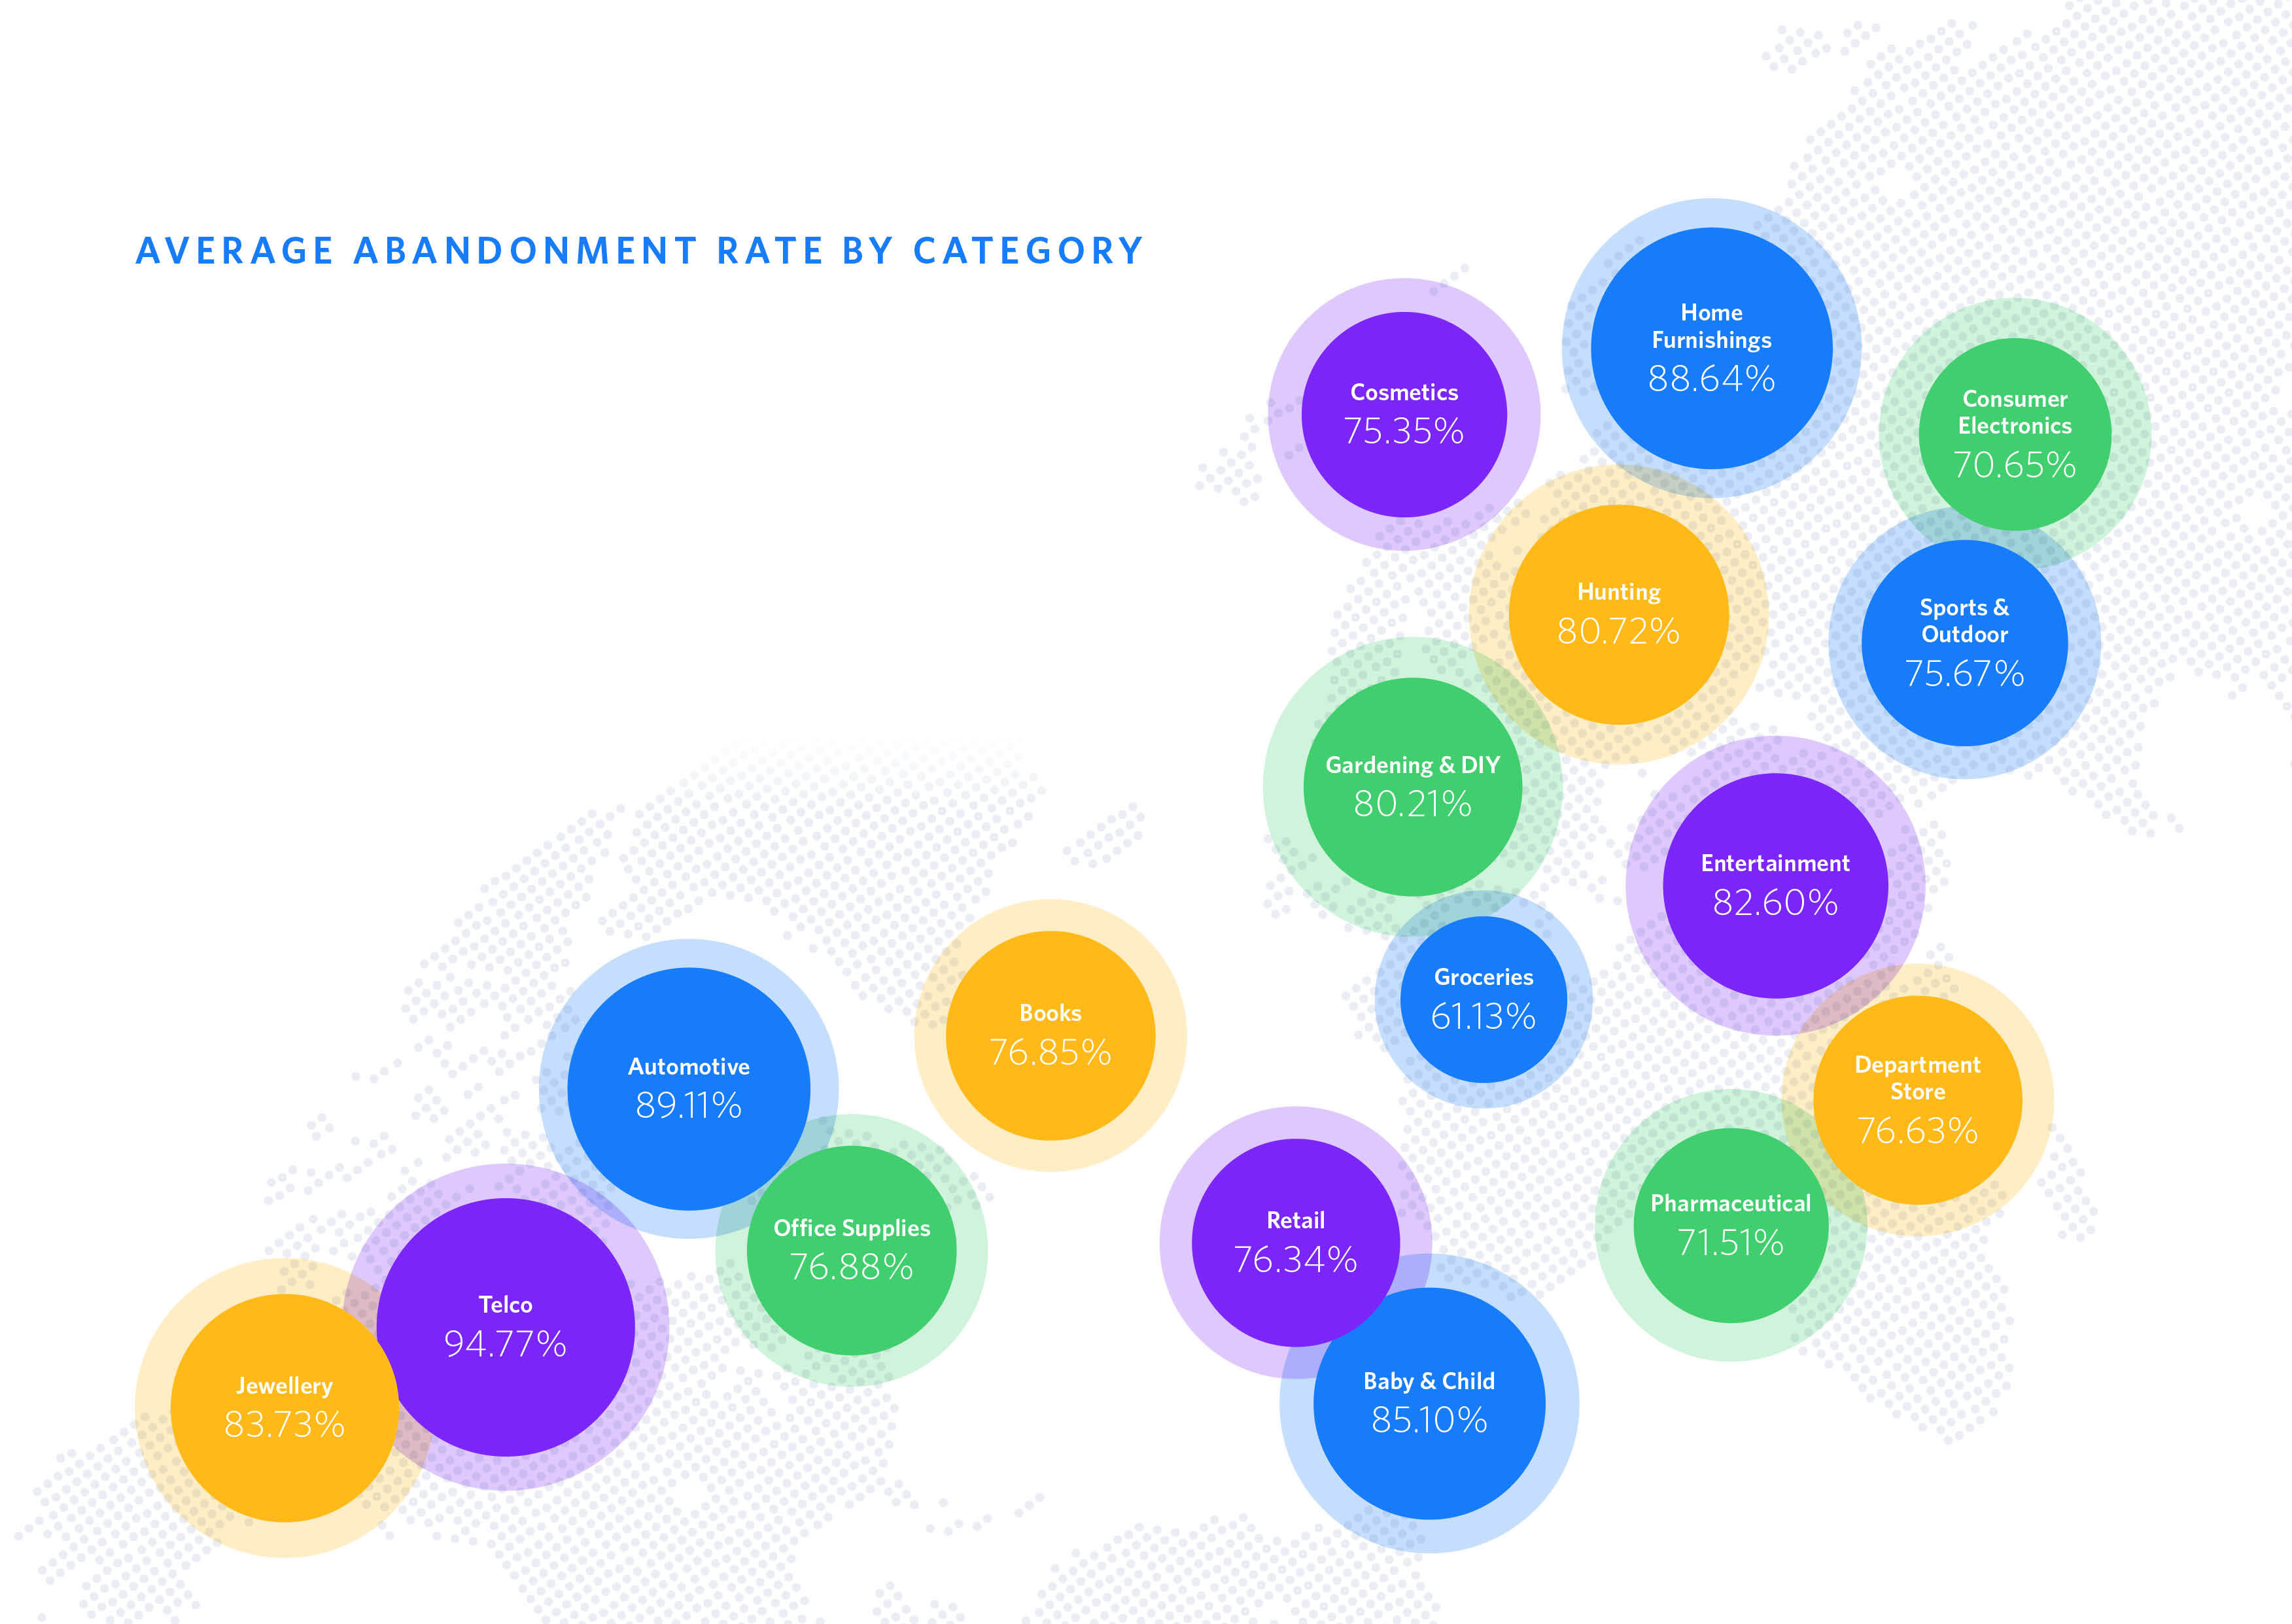
Retail
Online sales in the retail space spike at 10am and the trend line decreases after that before another small peak at 9pm.
With this increase in online sales in the retail sector there have been some sectors that have experienced solid abandonment trends compared to 2019. For example, pharmaceuticals (71.51%) and groceries (61.13%) have the lowest abandonment rates whereas home furnishings (86.64%) and automotive (89.11%) had the highest abandonment rates.
We can assume that the higher abandonment rate sectors have a much higher average order value. We can also attribute consumers buying lower abandonment rate products out of necessity whereas automotive and home furnishings aren’t.
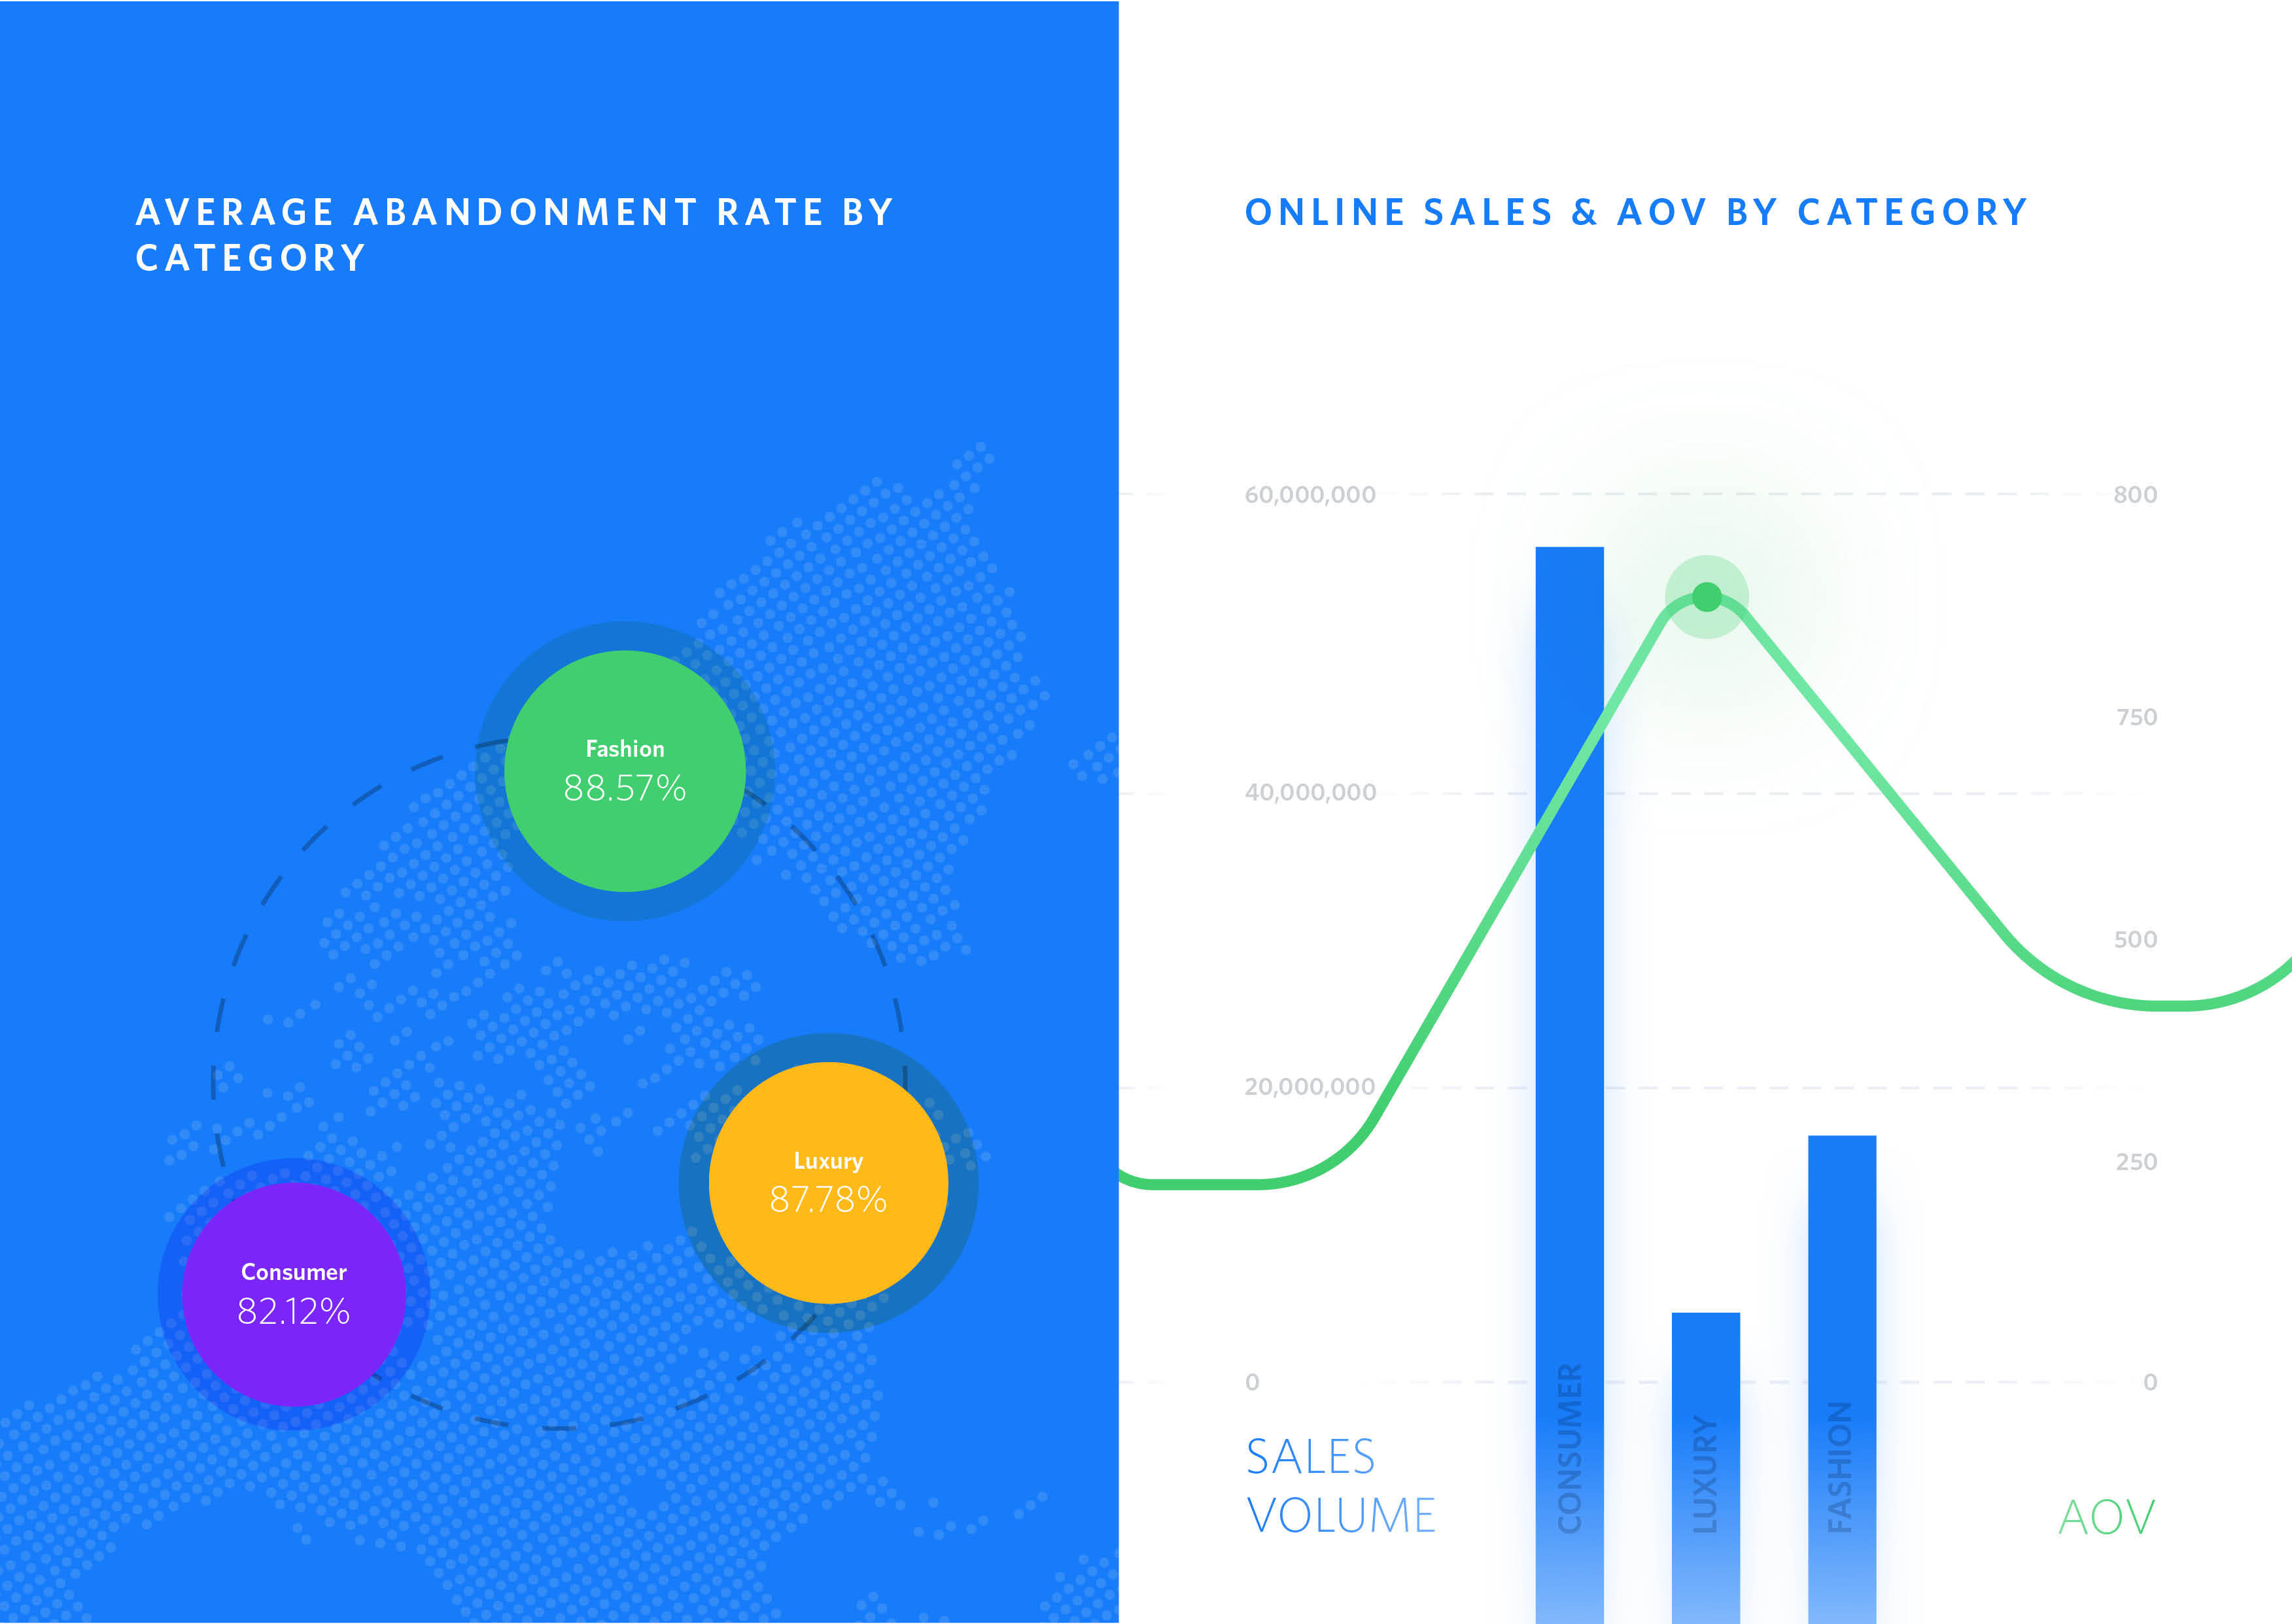
Fashion
Online conversions in the fashion industry spike at 8pm, which is vastly different from the retail sector. Although, as discussed previously, behaviours have changed since remote working so it’s no surprise the second highest hour for conversions in the fashion industry is 10am.
Similar to the retail space there are multiple sectors that read different abandonment rates. We analyse fashion, consumer and luxury. The abandonment rate for all sectors is as follows fashion (88.57%), consumer (82.12%) and luxury (87.78%) although they are all pretty similar when we look at online sales for each, consumer has by far the largest volume at almost 60,000,000, which is 3x more than the other two.
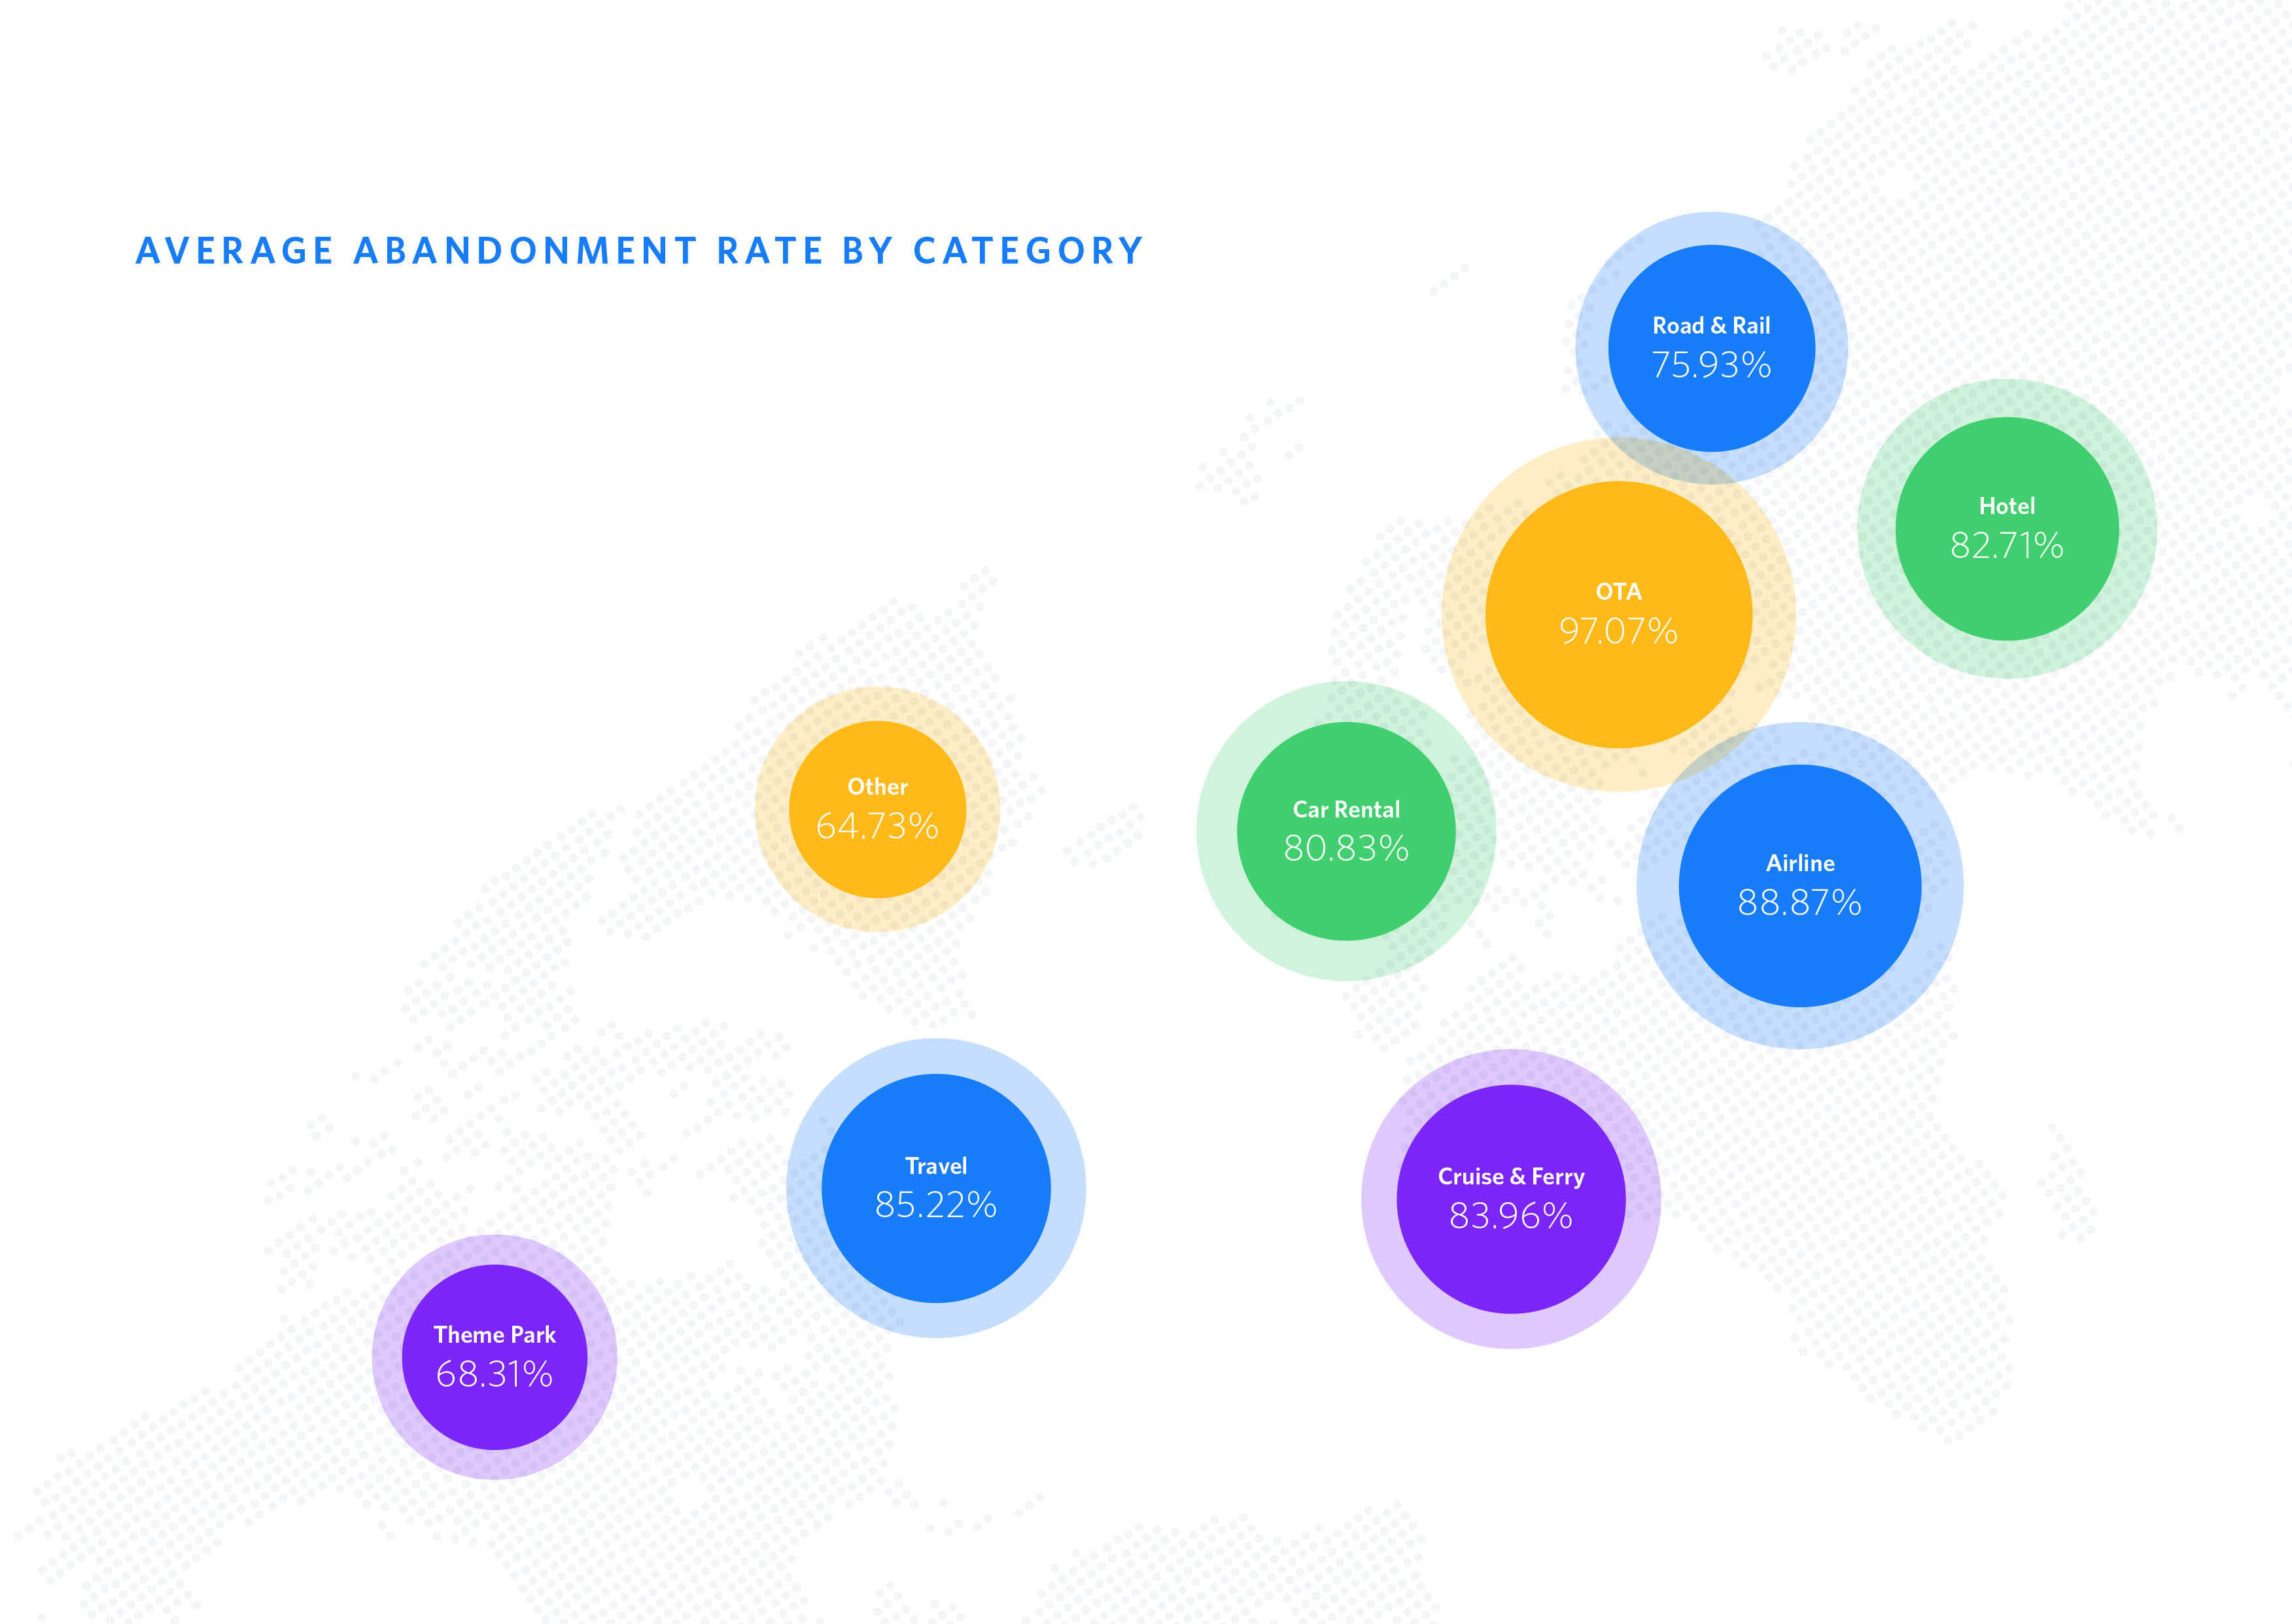
Travel
Online conversion in the travel sector peaked in January and crashed in April after the restrictions were announced. The rest of the year was turbulent and didn’t reach its previous high from January although we do see some conversion rate recovery in July and December.
The abandonment rate by category data found that airline (88.87%) and OTA (97.07%) had the highest abandonment rate throughout 2020, however the majority of sectors were all high compared to 2019.
In the travel space mobile traffic outperformed desktop by 10%. However, the average order value on mobile was significantly less than desktop. Desktop was 88% higher. This suggests that online shoppers are happy to browse for holidays on their mobile device but when it comes to completing their purchase desktop is the mode of choice.
Online Abandonment Statistics & Trends
Cart or basket abandonment happens when a user adds an item to their basket and then leaves without completing a purchase. For retailers, this is a common occurrence, but there are multiple strategies and tools to help combat this.
However, before putting a plan in place it’s a good idea to learn the abandonment patterns and behaviours of your community because this will allow you to launch the most effective campaigns.
Each sector has a different abandonment rate:
| Sector | 2019 | 2020 |
| Retail | 84.63% | 77.01% |
| Fashion | 88.46% | 84.43% |
| Travel | 85.44% | 87.08% |
The biggest shift here is in retail. As mentioned before, with retail categories like grocery, sports and outdoor and pharmaceuticals being in high demand we can see that shoppers were more sure of their purchase and completed in 2020 more than in 2019.
Travel, as expected, did see a slight increase but with less digital footfall this could be why the abandonment rate did not see an even bigger dip.
January and June saw the highest cart abandonment rates in 2020. In the SaleCyle 2021 Ecommerce Stats and Trends Report you can get in-depth abandonment data that includes day of the week, day of the month, time of day and much more.
About SaleCycle 2021 Stats & Trends Report
SaleCycle has worked with hundreds of ecommerce clients over the past ten years, helping them to recover abandoned sales, and increase online conversions.
SaleCycle provides a comprehensive overview of the state of ecommerce in 2020. Data from over 150 million online conversions and user journey’s witnessed across many sectors including retail, fashion and travel has been used to create this report.
We provide detailed insight on 3 segments and multiple sub-segments in the areas of retail, fashion, travel and more. We also dig into global trends, conversion rate optimisation, online behavior and more.
For this report, we’ve collected a wide variety of data which shows ecommerce sales growth and patterns. We explore how shoppers behave across different sectors and devices, and abandonment trends.
Download SaleCycle 2021 Ecommerce Stats & Trends Report
By Bradleigh Ward, Search & Content Manager at SaleCycle
Published 18/05/21
