From Revenue Growth and Conversion Rate, to Website Traffic Volume and Add to Bag Rates, you can overlay your results and discover how you compare against key industry performance metrics.

IMRG’s Digital Dashboard
See exactly how your performance compares
The IMRG Digital Dashboard is the UK’s only eCommerce benchmarking platform of this depth, giving you a clear view of how your performance compares across retailers, sectors and key metrics.
Built on data from 220+ leading retailers and representing £30bn+ in online spend, it is the source of IMRG’s Online Retail Index, drawing on over a decade of eCommerce data.
Benchmark the performance of your entire customer journey
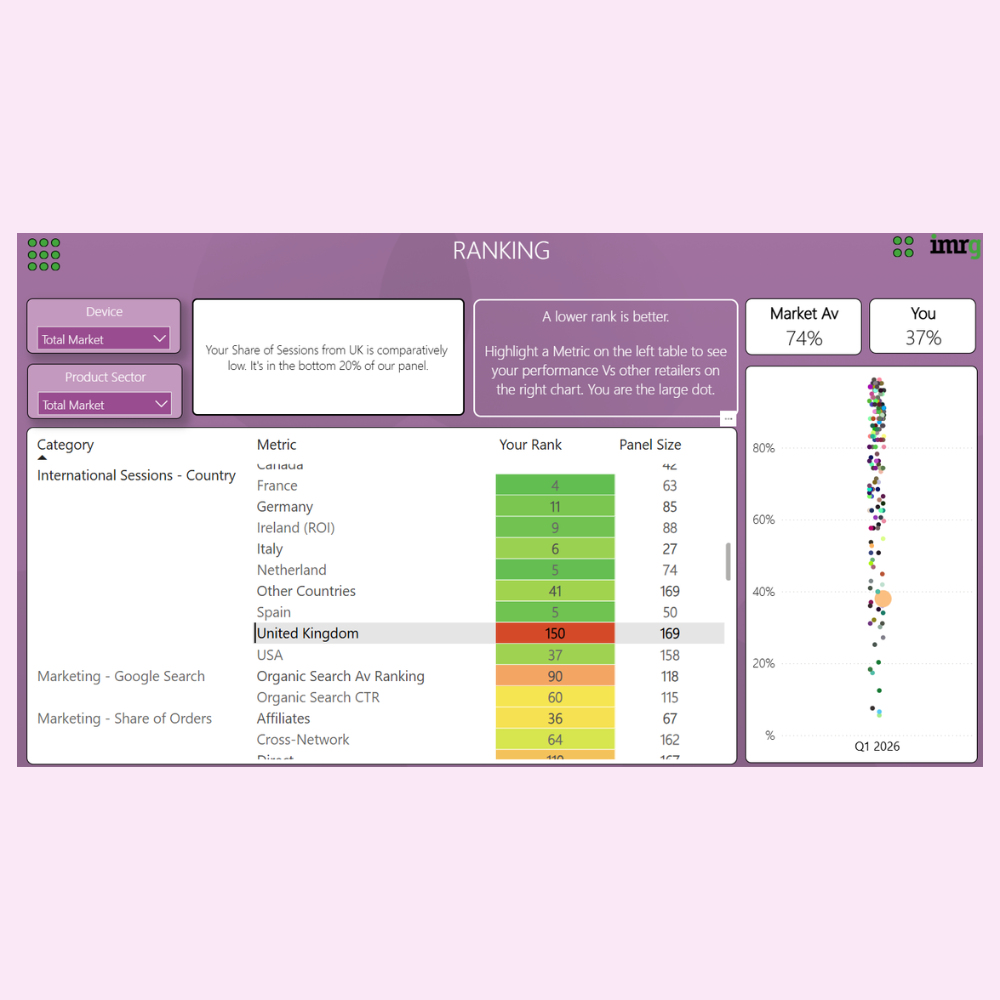

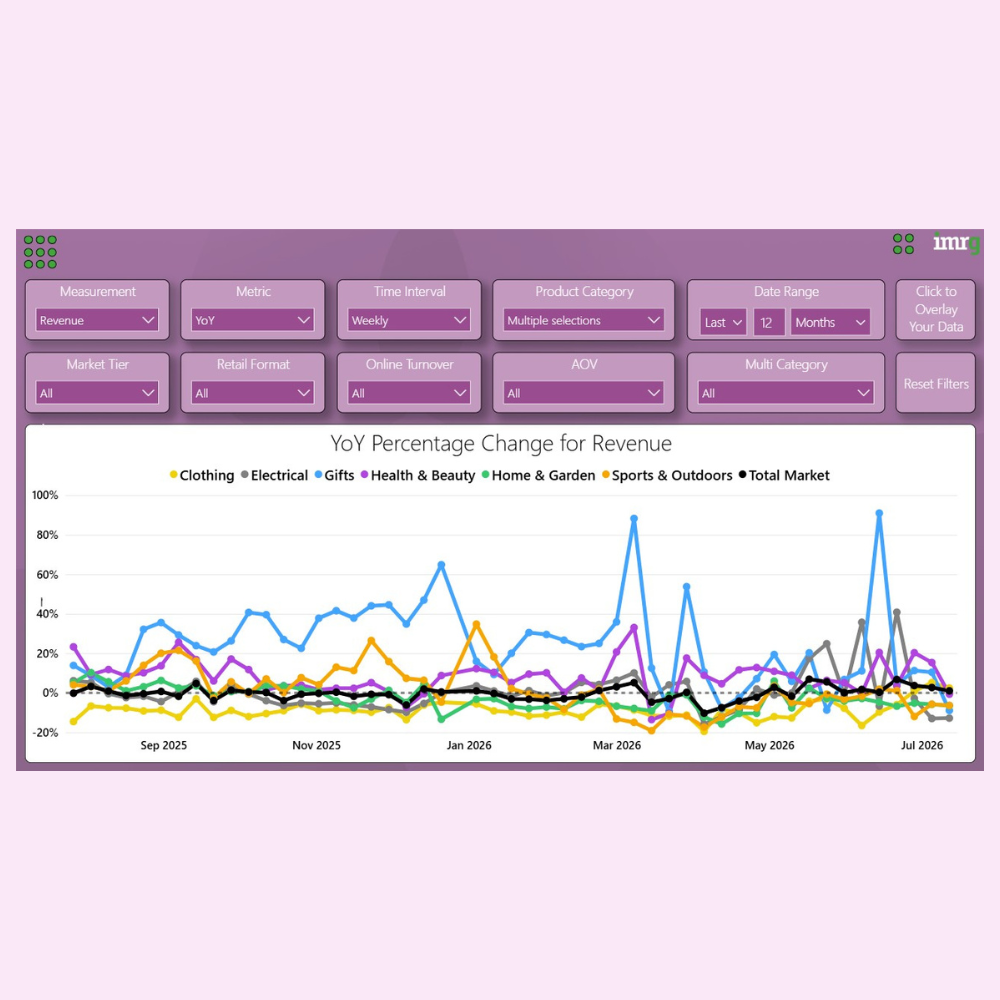
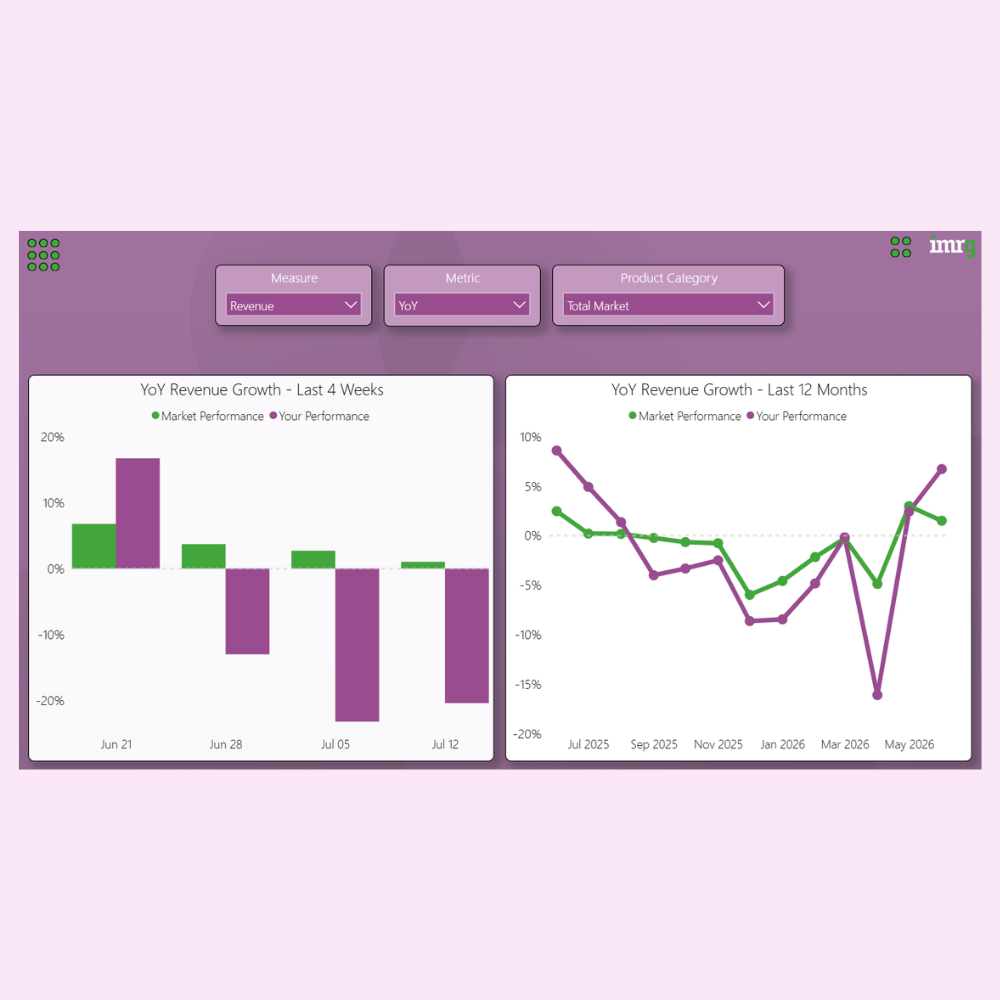
A complete view of market performance
Each week, retailers contribute core performance data, including revenue, orders, and traffic. IMRG aggregates and analyses this data to produce daily, week-on-week, month-on-month, and year-on-year benchmarks.
All data is anonymised and presented at a market level, ensuring accurate and secure comparison across the industry.
Total Market
Beers & Wines
Gifts
Jewellery
Clothing:
Womenswear, Menswear, Footwear, Accessories, Lingerie, Baby & Toddler, Children's Wear
Health & Beauty:
Beauty, Fragrance, Haircare, Makeup, Skincare, Men's Beauty, Toiletries
Sports & Outdoors
Electrical:
Audio, Visual & Entertainment, Large Appliances, Small Appliances, Accessories & Hobbies, Gaming & Computing
Home & Garden:
Home, Furniture, Homewares & Decorations, Home Improvement, Garden, Garden Furnishings, Gardening
Mobile Commerce:
Smartphone, Tablet
Website Performance:
Revenue, Orders, Traffic | Year-on-Year, Week-on-Week, Month-on-Month, Year-To-Date | Average Order Value | Conversion Rate | Visitor Bounce Rate | Basket Abandonment | Checkout Abandonment
Customer Funnel:
View A Product Page | Add To Bag Rate | Go To Checkout Rate | Checkout To Payment Rate
Device Share:
Desktop, Smartphone, Tablet | Share Of Sessions By Browser And Operating System
Discounting:
Share Of Orders That Used A Discount Code
Basket Analysis:
Average order value | Average Selling Price Per Item | Average Shipping Cost | Number Of Items/Products Per Order
Marketing:
Revenue, Orders, Traffic Split Across Marketing Channels (Affiliates, Audio, Cross-network, Direct, Display, Email, Mobile Push Notifications, Organic Search, Organic Shopping, Organic Social, Organic Video, Paid Other, Paid Search, Paid Shopping, Paid Social, Paid Video, Referral, SMS) | Total Market And Sector Analysis By Quarter
International:
Percentages Of Sessions Within The UK | Percentages Of Sessions Within The EU | Percentage Of Sessions Rest Of The World
Users:
Active User Purchase Rate | First Time Purchase Rate | First User Source - AI | First User Source - Search Engines | Single Visit Rate
Site Navigation:
Average Engagement time | Basket Abandonment | Visitor bounce rate | Basket abandonment | Checkout abandonment | Home Page Bounce Rate | Home Page Start Rate | Page Views Per Session | Page Views Per User | Product Page Bounce Rate | Site Search Percentage | Time Spent on Search Results Page | Visitor Bounce Rate
Also within the Digital Dashboard...
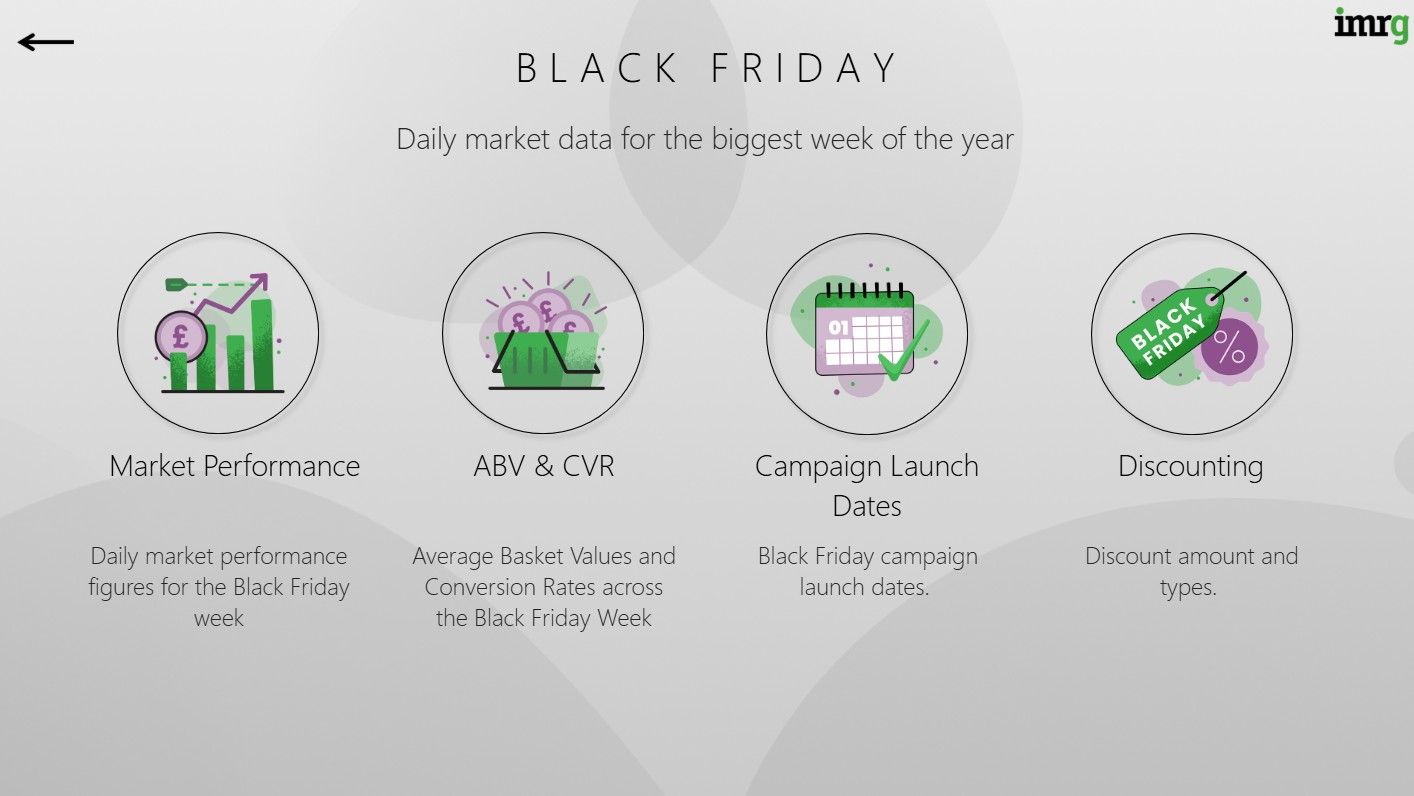
Access Black Friday performance data on demand with IMRG’s Black Friday Tracker that is hosted on the Digital Dashboard. Track daily benchmarks from 150+ leading retailers across key metrics and categories, enabling you to adapt your strategy throughout Peak week. Powered by 8 years of data, get the insights you need in November, without waiting for post-peak reports.
Featuring:
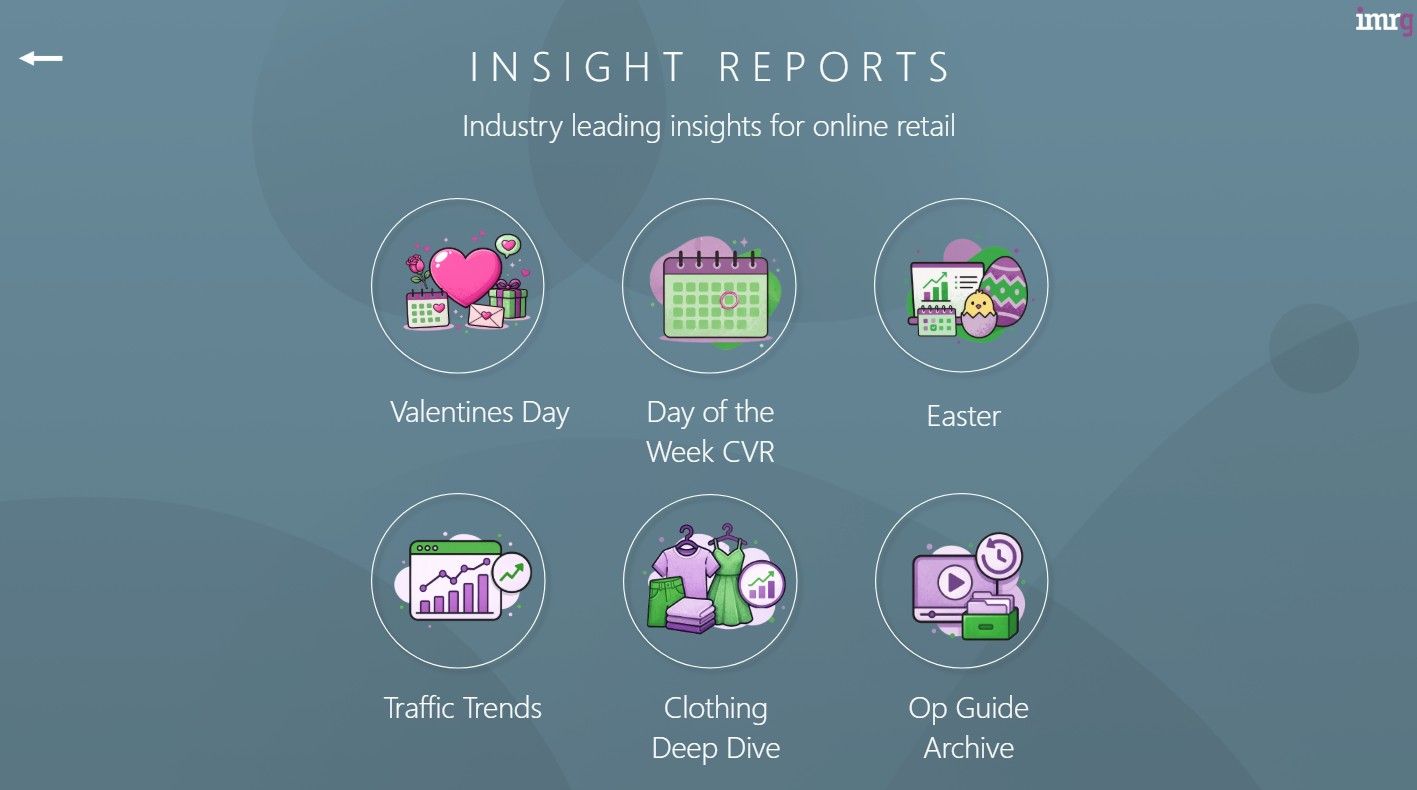
IMRG produces insight reports that are hosted within the Digital Dashboard, delving deep into a range of eCommerce-related topics to give you a comprehensive understanding of market wide trends and how your performance compares.
Examples include:
Frequently Asked Questions
Yes, absolutely! You can book a demo session with IMRG, where we’ll show you the dashboard in action and answer any technical questions you might have.
During the demo, we’ll also show you some of the fascinating insights available, including those relevant to your sector. The insights taken from the demo session will help you to understand its true power and value for your business.
Yes, all of your data is 100% anonymised and we guarantee that your data is in safe hands.
Our data policy ensures that none of our members are able to figure out what data belongs to which member.
All of the data within the Dashboard is anonymised and aggregated by trusted IMRG Data Experts.
If you’d like more information about how we manage the data you provide, please contact us at [email protected].
You don’t have to provide your company’s data to access the Digital Dashboard, but this means that you won’t be able to use the Dashboard to its full potential.
By providing your data you will be able to overlay this within the Dashboard and gain the full benchmarking experience.
When you overlay your data in the Dashboard you can benchmark your business against all of the key metrics that we track.
The data that we require you to provide is:
Don’t worry if you don’t provide your company’s data, you will still gain access to all of the key features within the dashboard, including general market data and all key metric trend analysis.
IMRG’s Digital Dashboard helps you better understand and improve your online performance
